Hospitalisations due to dementia

In 2021–22, there were just over 11.6 million hospitalisations in Australia. Of these, about 25,700 were hospitalisations due to dementia, which is equivalent to 2 out of every 1,000 hospitalisations in Australia.

Table 9.1 shows that of the hospitalisations due to dementia in 2021–22:

  • there were more hospitalisations for men than women (13,300 hospitalisations compared to 12,300 hospitalisations)
  • men also had a higher age-standardised rate of hospitalisations than women (49.7 hospitalisations for men and 36.2 hospitalisations for women, per 10,000 population aged 60 and over)
  • the average length of stay was 14.8 days – this was 5 times higher than the average length of stay of 2.7 days for all hospitalisations (AIHW 2023a)
  • the average length of stay was longer for men (15.9 days) than women (13.6 days).
Table 9.1: Overview of hospitalisations due to dementia in 2021–22 by sex

Measure

Men

Women

Persons

Number of hospitalisations

13,300

12,300

25,700

Age-standardised rate (number per 10,000)

49.7

36.2

42.3

Average length of stay, days per hospitalisation

15.9

13.6

14.8

Total number of bed days

212,000

168,000

380,000

Note: Age-standardised rates, which apply to people aged 60 and over, were standardised to the Australian population as at 30 June 2001 and are expressed per 10,000 population.

Source: AIHW analysis of National Hospital Morbidity Database.

With increasing age, hospitalisations due to dementia increased in number but decreased in length

There were distinct patterns in hospitalisations due to dementia in 2021–22 by age and sex (Figure 9.1):

  • the number of hospitalisations for both men and women increased with age up to 80–84 years, then decreased in the older age groups
  • the rate of hospitalisations increased for both men and women up to age 90–94, before decreasing among those aged 95 and over
  • people with younger onset dementia (aged under 65) had a greater average length of stay (31 days) than older people – the average length of stay decreased with increasing age, to 11 days for people hospitalised due to dementia aged 95 and over. This trend was observed among both men and women
  • the trend of the total number of bed days was the same across all sexes, increasing to the 80–89 age group and decreasing with the 95+ age group having the least number of total bed days.

Figure 9.1: Overview of hospitalisations due to dementia in 2021–22, by age and sex

Figure 9.1 shows various measures of hospitalisations due to dementia in Australia by sex and age, including: the estimated number of hospitalisations due to dementia, rate of hospitalisations (per 10,000 population), bed days and average length of stay (days). Distinct patterns are explained in the previous paragraphs.

Hospitalisations due to dementia increased over time 

All rates have been age-standardised to adjust for population differences, providing a more accurate reflection of changes over time. Figure 9.2 shows the number and age-standardised rate of hospitalisations due to dementia between 2012–13 and 2021–22:

  • the rate of hospitalisations increased gradually each year from 2012–13 to 2014–15 (5.4% annual average increase) and from 2015–16 to 2021–22 (1.0% annual average increase) 
  • between 2014–15 and 2015–16 there was a large increase in both the number of hospitalisations (24% increase) and the age-standardised rate (22% increase). This increase is likely due to changes in coding for rehabilitation which came into effect in 2015–16 (see Box 9.2 for more information)
  • although the numbers of hospitalisations were similar throughout the period, men consistently had higher rates of hospitalisations than women.

Figure 9.2: Hospitalisations due to dementia between 2012–13 and 2021–22: number and age-standardised rates

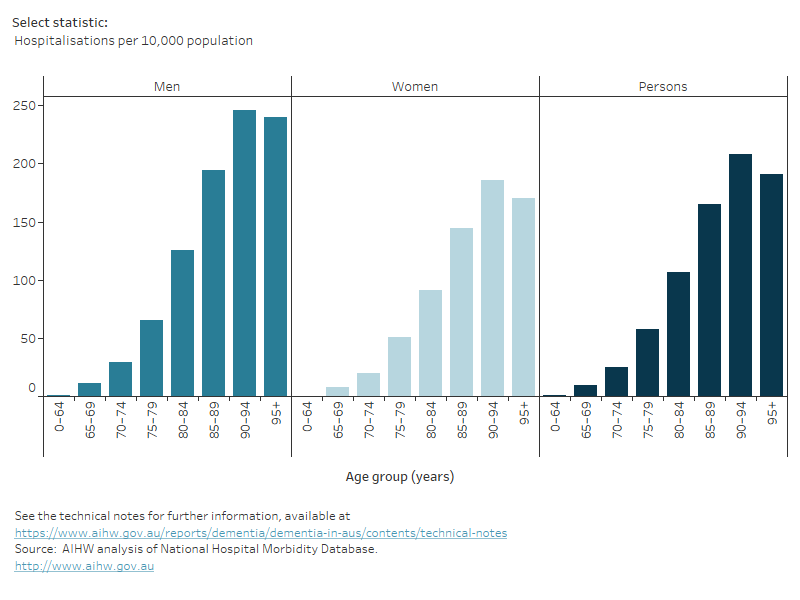
Figure 9.2 shows two line graphs showing the estimated number and age-standardised rates of hospitalisations due to dementia in Australia by sex between 2012–13 and 2021–22. Distinct patterns are explained in the previous paragraphs.

Box 9.2: Coding changes impacting hospitalisations due to dementia over time

With many national health data collections, the primary purpose is to support the administrative objectives of the collecting organisation rather than to monitor disease. Factors such as changes in coding practices may affect how well conditions are recorded in the data. 

The period 2014–15 to 2015–16 saw a substantial increase in hospitalisations due to dementia (where dementia was the principal diagnosis). In July 2015, a new coding standard ACS2104 Rehabilitation was introduced into the ICD-10-AM. Changes that may have led to an increase in admissions with dementia coded as the principal diagnosis include:

  • prior to July 2015, patients who were admitted to hospital specifically for rehabilitation were assigned a principal diagnosis of Z50.9 Care involving use of rehabilitation procedure, unspecified, and the condition which led to the need for rehabilitation (such as dementia) was assigned as an additional diagnosis
  • in July 2015, this coding standard was revised so that the principal diagnosis should be assigned to the condition which led to the need for rehabilitation, and Z50.9 Care involving use of rehabilitation procedure, unspecified should be assigned as an additional diagnosis

When changes such as these are implemented in short time periods, distinct steps up or down in numbers and rates are expected to be observed in administrative data.

About a third of hospitalisations due to dementia were for Alzheimer’s disease

In 2021–22, the most common dementia types recorded in hospitalisations due to dementia were: 

  • Alzheimer’s disease (29%)
  • Other dementia (20%)
  • Unspecified dementia (16%)
  • Vascular Dementia (12%) (Figure 9.3).

There were differences by sex in the dementia types recorded in hospitalisations due to dementia. Compared to men, there was a slightly higher proportion of hospitalisations among women due to Alzheimer’s disease (30% of women compared with 28% of men) and Unspecified dementia (18% of women compared with 14% of men). There was a higher proportion of men with hospitalisations due to Vascular dementia than women (14% of men compared with 9.0% of women).

Although not a distinct type of dementia, delirium superimposed on dementia occurs when a person with pre-existing dementia experiences delirium, and is a common cause of hospitalisations among people with dementia. In 2021–22, 15% of hospitalisations due to dementia were for Delirium superimposed on dementia (Table S9.3). 

As a person may have multiple types of dementia, it is possible to have more than one type of dementia recorded among hospitalisations with dementia. While the majority of dementia hospitalisations had only one type of dementia recorded, almost 10% (about 8,700 hospitalisations) had 2 or more types recorded. 

Figure 9.3: Hospitalisations due to dementia in 2021–22: percentage, by type of dementia and sex

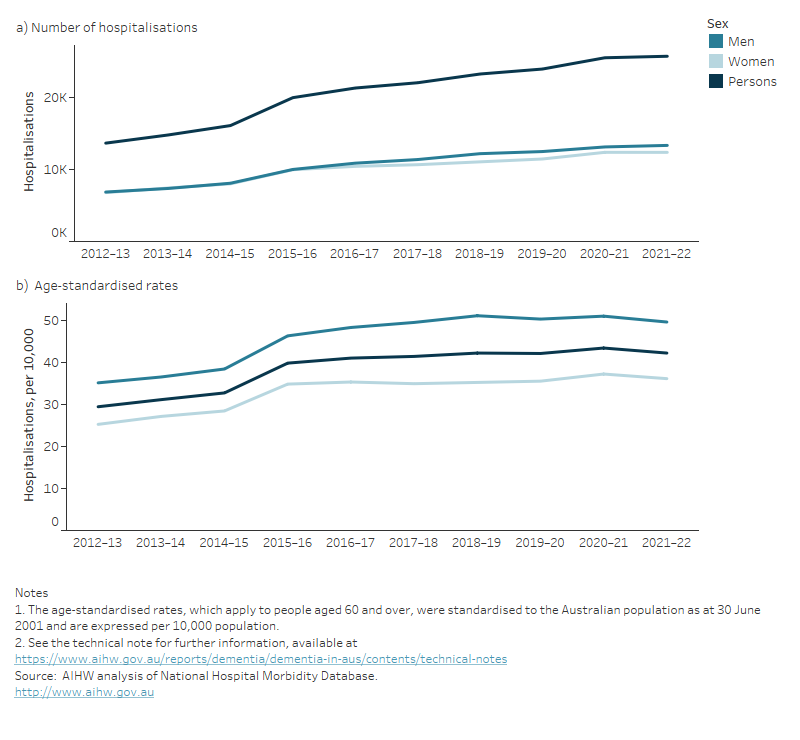
Figure 9.3 is a bar graph showing the percentage of hospitalisations due to dementia in Australia by type of dementia and sex in 2021–22. The most common dementia type recorded was Alzheimer’s disease. Distinct patterns are explained in the previous paragraphs.

How did hospitalisations due to dementia end?

In 2021–22, 40% of all hospitalisations due to dementia ended in the patient being discharged home (Figure 9.4). This proportion was considerably less than seen for all hospitalisations in 2021–22, where 93% ended in the patient being discharged home (AIHW 2023c).

Of all dementia hospitalisations, 5.2% of hospitalisations were discharged to their usual place of residence which was a residential aged care facility. 14% were transferred to a residential aged care facility which was not their usual place of residence. Of those discharged or transferred to a residential aged care facility, 2 in 3 patients were aged over 80 (Table S9.9).

Around 24% of hospitalisations due to dementia ended with a ‘Statistical discharge’, which is when the intent of care changed during their stay in hospital (for example, from acute care to rehabilitation or palliative care). A further 9.2% ended with discharge or transfer to another acute hospital and 5.2% ended with the death of the patient.

Figure 9.4: All hospitalisations and hospitalisations due to dementia in 2021–22: percentage, by mode of separation

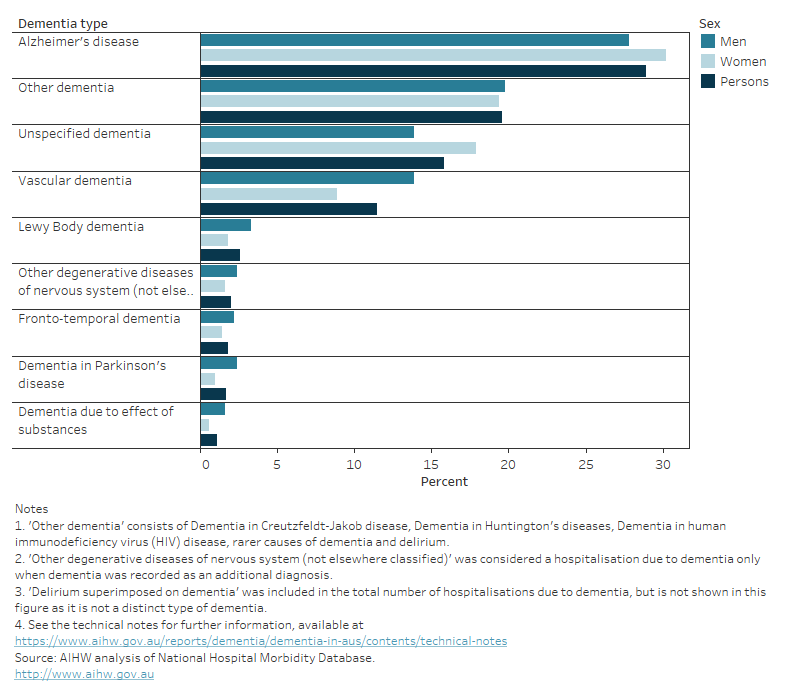
Figure 9.4 is a bar graph showing the percentage of all hospitalisations, and hospitalisations due to dementia in Australia by mode of separation. Distinct patterns are explained in the previous paragraphs.

When Australians were hospitalised due to dementia, what other conditions did they have?

When Australians were admitted to hospital due to dementia, the most common other diagnoses (additional diagnosis and supplementary diagnosis), other than dementia were:

  • hypertension
  • arthritis and osteoarthritis primary
  • constipation
  • ischaemic heart disease, also known as coronary heart disease (AIHW 2023b)
  • depression

Three of these diagnoses are closely related to the modifiable risk factors for dementia, hypertension, ischemic heart disease and depression. For further information on the top 10 other diagnoses, see Table S9.11

6% of all hospitalisations due to dementia involved palliative and other end-of-life care

In 2021–22, there were over 900 palliative care-related hospitalisations due to dementia, accounting for 5.8% of all hospitalisations due to dementia (3.6% for palliative care and 2.2% for other end-of-life care) (Figure 9.5a). Palliative care-related hospitalisations include hospitalisations with a care type of palliative care, in which specialist palliative care is provided, as well as hospitalisations where a palliative care diagnosis was recorded, but care was not necessarily delivered by a palliative care specialist (referred to as other end-of-life care). See Palliative care services in Australia for more detail.

Compared to women, men tended to have higher rates of hospitalisations due to dementia involving palliative care or other end-of-life care, and this held across most age groups; for both men and women, the rate of hospitalisations increased with age (Figure 9.5b).

Figure 9.5: Palliative care and other end-of-life care hospitalisations due to dementia in 2021–22, by age and sex: (a) number and (b) age-specific rate

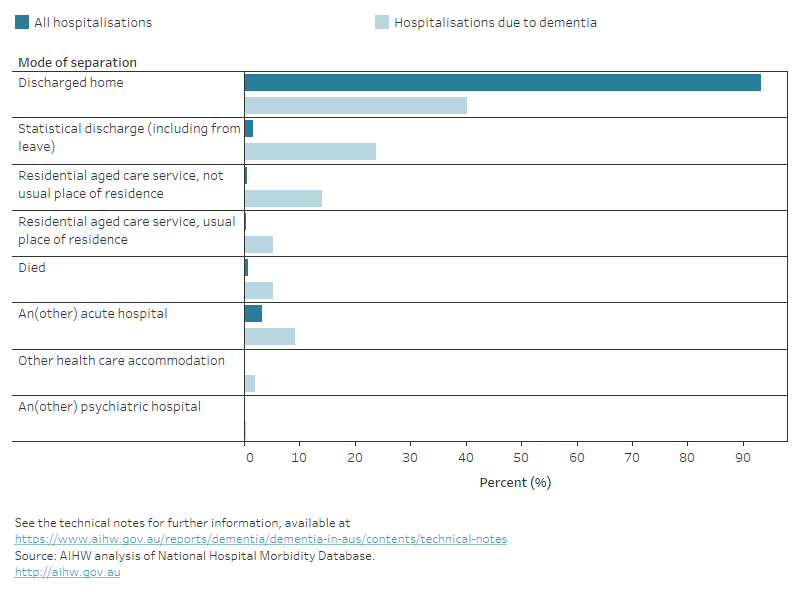
Figure 9.5 shows two bar graphs showing the estimated number and age-specific rates of palliative care and other end-of-life care hospitalisations due to dementia in Australia by sex and age in 2021–22. The trends across both palliative care and other end-of-life hospitalisations are similar. The number of hospitalisations increases to about the 85–89 age group and decreasing after. The age-specific rates increase as age increases.

How do hospitalisations due to dementia vary by geographic and socioeconomic areas?

Figure 9.6 shows the age-standardised rate of hospitalisations due to dementia by state and territory, remoteness areas and socioeconomic areas for 2021–22. 

In 2021–22, after adjusting for population differences, the age-standardised rate of hospitalisations due to dementia for people aged 60 and over:

  • varied across states and territories – ranging from 34 hospitalisations per 10,000 population in ACT to 56 hospitalisations per 10,000 population in Queensland
  • varied by remoteness – the rate of hospitalisations due to dementia was highest in Major cities (45 hospitalisations per 10,000 population) and lowest in Remote areas (36 hospitalisations per 10,000 population)
  • was lowest among people living in the highest socioeconomic areas (37 per 10,000 population) and highest among people living in the lowest socioeconomic areas (47 per 10,000 population). The other socioeconomic areas had similar rates of hospitalisation (ranging between 42 and 44 per 10,000 population).

Socioeconomic and demographic factors such as income, education, employment, geographic access to health and social support services, as well as identifying as a First Nations or culturally and linguistically diverse (CALD) person, may impact hospitalisations of people with dementia. For more information refer to Hospital care for First Nations people with dementia and Dementia in priority groups.

Figure 9.6: Hospitalisations due to dementia in 2021–22: age-standardised rate, by state and territory, remoteness area and socioeconomic area

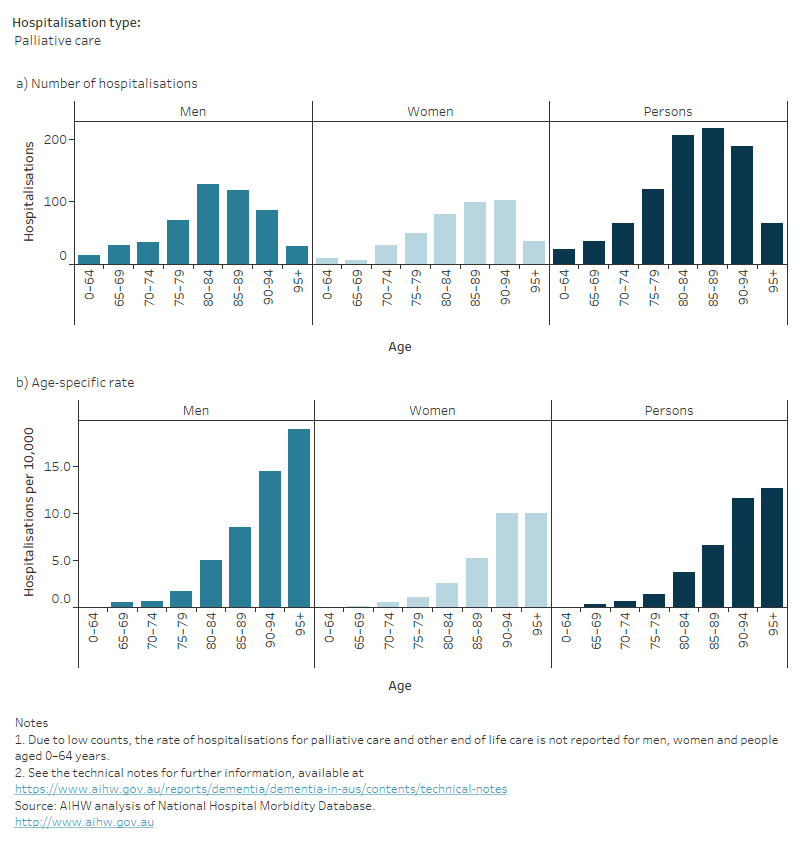
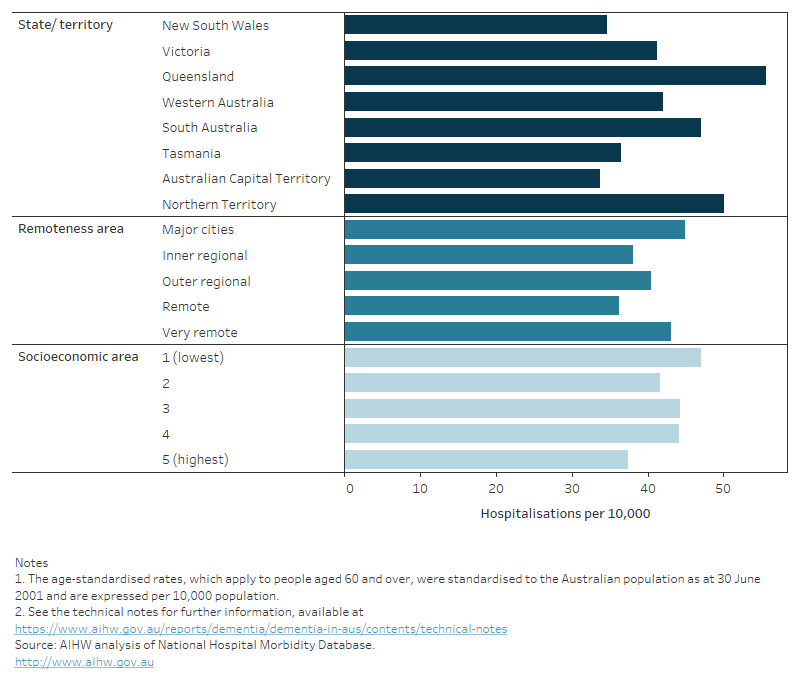
Figure 9.6 shows a bar graph showing the age-standardised rates of hospitalisations due to dementia by state or territory, remoteness areas and socioeconomic areas in 2020–21. Distinct patterns are explained in the previous paragraph.