Transport accidents
Citation
AIHW
Australian Institute of Health and Welfare (2023) Transport accidents, AIHW, Australian Government, accessed 09 December 2023.
APA
Australian Institute of Health and Welfare. (2023). Transport accidents. Retrieved from https://pp.aihw.gov.au/reports/injury/transport-accidents
MLA
Transport accidents. Australian Institute of Health and Welfare, 06 July 2023, https://pp.aihw.gov.au/reports/injury/transport-accidents
Vancouver
Australian Institute of Health and Welfare. Transport accidents [Internet]. Canberra: Australian Institute of Health and Welfare, 2023 [cited 2023 Dec. 9]. Available from: https://pp.aihw.gov.au/reports/injury/transport-accidents
Harvard
Australian Institute of Health and Welfare (AIHW) 2023, Transport accidents, viewed 9 December 2023, https://pp.aihw.gov.au/reports/injury/transport-accidents
Get citations as an Endnote file: Endnote
On this page:
Introduction
Types of transport involved in injury hospitalisations
Types of transport involved in injury deaths
Seasonal differences
Trends over time
Age and sex differences
Severity
Types of injury sustained
Aboriginal and Torres Strait Islander people
Remoteness
Data details
References
Related AIHW publications
This content contains information some readers may find distressing.
If you, or someone you know needs help, contact Lifeline on 13 11 14. Go to the crisis and support services page for a list of support services.
Transport is part of our daily lives and a major component of the economy. Unfortunately, every year, thousands of Australians are hurt or die in road and other transport accidents, most commonly while in a car, or on a motorcycle or bicycle.
Transport injuries resulted in around:
61,500 hospitalisations in 2021–22
240 per 100,000 population
1,400 deaths in 2020–21
5.4 per 100,000 population
This represents 11% of injury hospitalisations and 10% of injury deaths. Males and young people are particularly at risk, and fractures are the most common type of injury sustained in hospitalised cases.
This report summarises data on unintentional transport injuries resulting in hospitalisation or death. Intentional injuries are included under Self-harm injuries and suicide or Assault and homicide.
Types of transport involved in injury hospitalisations
In 2021–22, 31% of transport injury hospitalisations were for car occupants and 24% were for motorcyclists (Table 1).
Mode of transport |
Hospitalisations |
% |
Rate (per 100,000) |
---|---|---|---|
Car occupants (V40–49) |
19,049 |
31 |
74 |
Motorcyclists (V20–29) |
14,865 |
24 |
58 |
Pedal cyclists (V10–19) |
14,796 |
24 |
58 |
Pedestrian (V00–09) |
3,510 |
6 |
14 |
Other or unspecified (V30–39, V50–99) |
9,263 |
15 |
36 |
Total |
61,483 |
100 |
239 |
Notes
- Rates are crude per 100,000 population.
- Percentages may not total 100 due to rounding.
- Codes in brackets refer to the ICD-10-AM (11th edition) external cause codes (ACCD 2019).
Source: AIHW National Hospital Morbidity Database.
For more detail, see Data tables B1–2.
Types of transport involved in injury deaths
In 2020–21, 53% of transport injury deaths were for car occupants and 18% were for motorcyclists (Table 2).
Mode of transport |
Number |
% |
Rate (per 100,000) |
---|---|---|---|
Car occupants (V40–49) |
736 |
53 |
2.9 |
Motorcyclists (V20–29) |
248 |
18 |
1 |
Pedestrian (V01–09) |
172 |
12 |
0.7 |
Pedal cyclists (V10–19) |
36 |
3 |
0.1 |
Other or unspecified (V30–39, V50–99) |
202 |
14 |
0.8 |
Total |
1,394 |
100 |
5.4 |
Notes
- Rates are crude per 100,000 population.
- Percentages may not total 100 due to rounding.
- Codes in brackets refer to the ICD-10 external cause codes (WHO 2011).
Source: AIHW National Mortality Database.
For more detail, see Data tables E1–2.
Trends over time
Over the period from 2017–18 to 2021–22, the age-standardised rate of hospitalisations due to transport injuries decreased by an annual average of 1.2%. From 2011–12 to 2016–17 there was an average annual increase of 1.0%.
There is a break in the time series for hospitalisations between 2016–17 and 2017–18 due to a change in data collection methods (see the technical notes for details).
For transport deaths, the age-standardised rate for 2020–21 was 2.0% higher than a year earlier. Between 2011–12 and 2020–21 the rate decreased by an annual average of 2.8% (Figure 1).
Figure 1: Transport injury hospitalisations and deaths, by sex and year
The graph shows 2 matching sets of 3 lines on separate tabs, 1 tab for hospitalisations and 1 for deaths. The 3 lines represent the trend for males, persons, and females. The reader can choose to display rate per 100,000 population or number.

For more detail, see Data tables C1–3 and F1–4.
Seasonal differences
Hospital admissions due to transport injuries suggest some patterns over the year. There are two peaks per year, around October and April, potentially due to increased traffic during school holidays.
The interactive display shows other seasonal changes in injury hospitalisations.
Figure 2: Seasonal differences in transport injury hospitalisations, 2019–20 to 2021–22
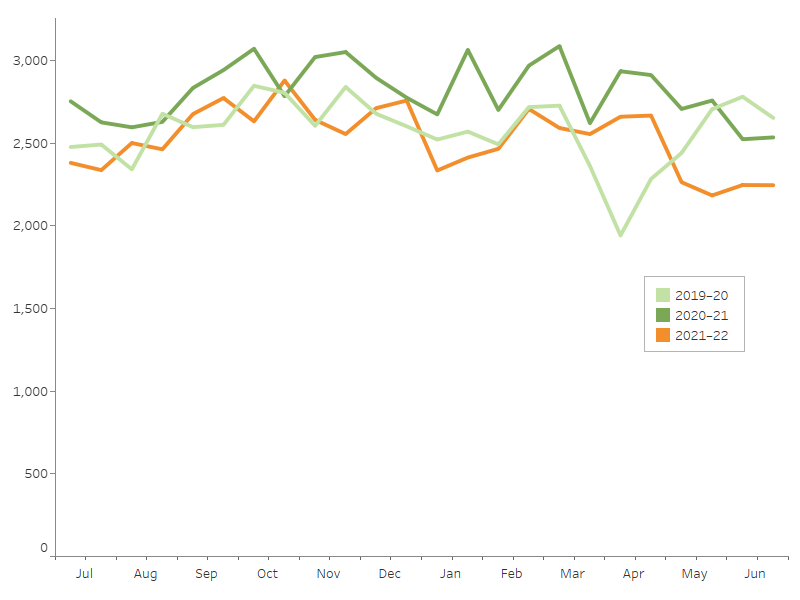
Notes
- Admission counts have been standardised into two 15-day periods per month.
- A scale up factor has been applied to June admissions to account for cases not yet separated.
Source: AIHW National Hospital Morbidity Database.
Age and sex differences
Rates of hospitalisation and death caused by transport injuries differ between males and females, especially for certain age groups (Figure 3).
For transport injury hospitalisations in 2021–22:
- 2 in 3 hospitalisations were for males (68%)
- the age-standardised rates were:
- 330 cases per 100,000 males, and
- 155 cases per 100,000 females
- young people aged 15–24 had the highest rate.
For transport injury deaths in 2020–21:
- 3 in 4 deaths were for males (77%)
- the age-standardised rates were:
- 8.2 deaths per 100,000 males, and
- 2.4 deaths per 100,000 females
- people aged 65 and over had the highest rate.
Figure 3: Transport injury hospitalisations and deaths, by age group and sex
The graph features 2 matching columns on separate tabs, 1 tab for hospitalisations and 1 for deaths. The columns represent sex within 6 life-stage age groups. For each age group, the reader can choose to display either rate per 100,000 population or number. The default displays males and females and the reader can also choose to display persons.

For more detail, see Data tables A1–3 and D1–3.
Severity
There are many ways that the severity, or seriousness, of an injury can be measured. Some of the ways to measure the severity of hospitalised injuries are:
- number of days in hospital
- time in an intensive care unit (ICU)
- time on a ventilator
- in-hospital deaths.
The average number of days in hospital for transport injuries was similar to the average for all hospitalised injuries in 2021–22, while the percentages of cases that included time in an ICU and cases that involved continuous ventilatory support were both higher. The rate of in-hospital deaths was lower (Table 3).
|
Transport injuries |
All injuries |
---|---|---|
Average number of days in hospital |
4.6 |
4.7 |
% of cases with time in an ICU |
3.6 |
2.0 |
% of cases involving continous ventilatory support |
2.1 |
1.1 |
In-hospital deaths (per 1,000 cases) |
3.6 |
5.9 |
Note: Average number of days in hospital (length of stay) includes admissions that are transfers from 1 hospital to another or transfers from 1 admitted care type to another within the same hospital, except where care involves rehabilitation procedures.
Source: AIHW National Hospital Morbidity Database.
For more detail, see Data tables A13–15.
Types of injuries sustained
In 2021–22, the head and neck was the body part most often identified as the main site of injury in transport hospitalisations (Figure 4), although this varies by the type of transport. In part, it may reflect the inherently more serious nature of head and neck injuries.
Figure 4: Transport injury hospitalisations by main body part injured, 2021–22
Outline of a person with labels for body parts accounting for hospitalisations due to transport crashes. Injuries to the head and neck accounted for the most hospitalisations, while the ankle and foot accounted for the fewest.
Notes
- Main body part refers to the principal reason for hospitalisation.
- ‘Trunk’ includes thorax, abdomen, lower back, lumbar spine & pelvis.
- Number and percentage of injuries classified as Other, multiple, and incompletely specified body regions and Injuries not described in terms of body region not shown—see Data table A11.
Source: AIHW National Hospital Morbidity Database.
For more detail, see Data table A11.
Fractures were by far the most common type of injury for people who were hospitalised due to a transport accident (Figure 5).
Figure 5: Transport injury hospitalisations by type of injury, 2021–22
Bar graph showing type of injury sustained by category and by sex. Fracture was the most common for both males and females but more than twice as frequent for males. Open wound was second for males, while superficial injury was second for female. The reader can choose to display either the crude rate per 100,000 population or the number of cases. The default display shows data for males and females, the reader can also choose to display for persons.

For more detail, see Data table A10.
Aboriginal and Torres Strait Islander people
Among Aboriginal and Torres Strait Islander people:
- there were 3,400 hospitalisations due to transport accidents in 2021–22, with males twice as likely as females to be hospitalised (Table 4)
- there were 101 deaths in 2020–21 due to transport accidents, with males 2.1 times as likely to die (Table 5)
- hospitalisation rates were highest among people aged 15–24 (Figure 5).
|
Males |
Females |
Persons |
---|---|---|---|
Number |
2,357 |
1,072 |
3,429 |
Rate (per 100,000) |
536 |
244 |
390 |
Note: Rates are crude per 100,000 population.
Source: AIHW National Hospital Morbidity Database.
|
Males |
Females |
Persons |
---|---|---|---|
Number |
68 |
33 |
101 |
Rate (per 100,000) |
18 |
8.7 |
13 |
Notes
- Rates are crude per 100,000 population.
- Deaths data only includes data for New South Wales, Queensland, Western Australia, South Australia, and the Northern Territory.
Source: AIHW National Mortality Database.
For more detail, see Data tables A4–5 and D4–5.
Indigenous and non-Indigenous Australians
Indigenous Australians, when compared with non-Indigenous Australians, were:
- 1.7 times as likely to be hospitalised due to a transport accident in 2021–22 (Table 6)
- 2.8 times as likely to die in a transport accident in 2020–21 (Table 7).
|
Males |
Females |
Persons |
---|---|---|---|
Indigenous Australians |
530 |
245 |
386 |
Non-Indigenous Australians |
320 |
147 |
234 |
Notes
- Rates are age-standardised per 100,000 population.
- ‘Non-Indigenous Australians’ excludes cases where Indigenous status is missing or not stated.
Source: AIHW National Hospital Morbidity Database.
|
Males |
Females |
Persons |
---|---|---|---|
Indigenous Australians |
20 |
8.7 |
15 |
Non-Indigenous Australians |
8.4 |
2.4 |
5.3 |
Notes
- Rates are age-standardised per 100,000 population.
- ‘Non-Indigenous Australians’ excludes cases where Indigenous status is missing or not stated.
- Deaths data only includes data for people whose usual residence was New South Wales, Queensland, Western Australia, South Australia, and the Northern Territory.
Source: AIHW National Mortality Database.
The rate of transport injury hospitalisations was highest among the 15–24 age group for both Indigenous and non-Indigenous Australians (Figure 6). Deaths data are not presented because of small numbers.
Figure 6: Transport injury hospitalisations, by Indigenous status, by age group and sex, 2021–22
The visualisation features a column graph for hospitalisations. The columns represent data for Indigenous and non-Indigenous Australians by 6 life-stage age groups. The reader can select to display age-specific rate per 100,000 population or number. The reader can also select to display data for persons, males or females.

For more detail, see Data tables A4–6 and D4–8.
Remoteness
People living in Very remote areas, when compared with people living in Major cities, were:
- 2.4 times as likely to be hospitalised by a transport accident in 2021–22 (Table 8)
- 8.9 times as likely to die in a transport accident in 2020–21 (Table 9).
Males |
Females |
Persons |
|
---|---|---|---|
Major cities |
280 |
130 |
205 |
Inner regional |
427 |
199 |
313 |
Outer regional |
487 |
217 |
354 |
Remote |
640 |
275 |
465 |
Very remote |
641 |
309 |
482 |
Note: Rates are age-standardised per 100,000 population.
Source: AIHW National Hospital Morbidity Database.
Males |
Females |
Persons |
|
---|---|---|---|
Major cities |
4.4 |
1.3 |
2.8 |
Inner regional |
14 |
3.9 |
8.8 |
Outer regional |
20 |
5.8 |
13 |
Remote |
30 |
n.p. |
19 |
Very remote |
30 |
n.p. |
25 |
n.p. Not published because of small numbers, confidentiality or other concerns about the quality of the data.
Note: Rates are age-standardised per 100,000 population.
Source: AIHW National Mortality Database.
The highest rate of transport injury hospitalisation cases was among the 15–24 age group living in Remote areas of Australia. (Figure 7).
Deaths data are not presented in Figure 7 because of small numbers.
Figure 7: Transport injury hospitalisations, by remoteness, by age group and sex, 2021–22
Column graph for hospitalisations. The columns represent data for each of the 5 remoteness categories by 6 life-stage age groups. For each age group, the reader can choose to display rate per 100,000 population or number. The reader can also choose to display data for persons, males, or females.

For more detail, see Data tables A7–9 and D9–10.
For information on how statistics are calculated by remoteness, see the technical notes.
Data details
Technical notes: how the data were calculated
Data tables: download the full tables
The following are recent publications that include information on transport injuries. Search Reports for older publications.
The first year of COVID-19 in Australia: direct and indirect health effects
Pedal cyclist hospitalisations: estimating on-road cases (2000–01 to 2017–18)
Boating and watercraft-related injury in Australia (2017–18)
Spinal cord injury, Australia, 2017–18
Indigenous injury deaths, 2011–12 to 2015–16
Pedal cyclist injury deaths and hospitalisations, 1999–00 to 2015–16
Mobility scooter-related injuries and deaths (2011–12 to 2015–16)
Hospitalised farm injury, Australia: 2010–11 to 2014–15
Hospitalised injury due to land transport crashes (2014–15)
Injury of Aboriginal and Torres Strait Islander people due to transport, 2010–11 to 2014–15
ACCD (Australian Consortium for Classification Development) 2019. The international statistical classification of diseases and related health problems, 10th revision, Australian modification (ICD-10-AM), 11th ed. Tabular list of diseases and alphabetic index of diseases. Adelaide: Independent Hospital Pricing Authority (IHPA), Lane Publishing.
WHO (World Health Organization) 2016. International statistical classification of diseases and related health problems, tenth revision, 5th ed. Geneva: WHO.