
Older people
Topic last updated: | See what’s been updated
Key findings
People in Australia are at increased risk of abuse in their later years. This abuse can take many forms, including psychological or emotional abuse, financial abuse, physical abuse, sexual abuse, and neglect (ALRC 2017).
Elder abuse that occurs in families differs from other types of family and domestic violence because it often involves abuse of parents by adult children (Kaspiew et al. 2015; Qu et al. 2021). Abuse can also occur outside of the family, such as in aged care facilities and health care services (Joosten et al. 2017). Elder abuse can cause a range of physical, psychological, financial and social harms to older people (WHO 2022).
The number of older people in Australia experiencing abuse is likely to increase over time with Australia’s ageing population. While 17% of people in Australia were aged 65 and over in 2021, projections indicate that this group will make up around 21% of the population by 2066 (ABS 2018; 2021).
This page presents data on all forms of elder abuse, but focuses on elder abuse in the context of family, domestic and sexual violence where data are available.
What is elder abuse?
While there is no agreed definition for elder abuse, the definition most commonly used in Australia is from the World Health Organization:
Elder abuse is a single or repeated act or lack of appropriate action, occurring within any relationship where there is an expectation of trust, which causes harm or distress to an older person (WHO 2022).
A key aspect of the definition is that elder abuse occurs in relationships where there is ‘an expectation of trust’. Such relationships include those with family members, friends, neighbours, and some professionals such as paid carers.
In Australia, ‘older people’ are generally defined as those aged 65 and over. However, Aboriginal and Torres Strait Islander people are often included among ‘older people’ from the age of 50 (Kaspiew et al. 2015). These age groups are used to define older people in this page, unless stated otherwise.
What do we know?
Measuring elder abuse
Prevalence estimates of elder abuse vary according to setting, and by who is reporting the abuse. Evidence from international studies show that abuse estimates are higher for older people in institutional settings than in the community. Estimates are also higher where abuse is reported by institutional staff than by older people themselves (Box 1) ( WHO 2022; Yon et al. 2018).
A 2017 meta-analysis showed an overall international prevalence rate of 16% for self-reported elder abuse in community settings (Yon et al. 2017). The prevalence was highest for psychological abuse (12%), followed by financial abuse (6.8%), neglect (4.2%), physical abuse (2.6%), and sexual abuse (0.9%).
In institutional settings, Yon et al. (2018) found that a third (33%) of older adults had experienced psychological abuse. The next most common types of abuse were physical and financial abuse (both 14%), neglect (12%) and sexual abuse (1.9%). Notably, 2 in 3 institutional staff (64%) reported perpetrating some form of abuse against an older person in the past year (WHO 2022; Yon et al. 2018).
Prevalence estimates are likely to underestimate the true extent of elder abuse. This is because victim-survivors can be reluctant to disclose ill-treatment by a family member, or because they are dependent on the abuser for care (Qu et al. 2021). Older people with cognitive impairment (for example, dementia) or other forms of disability may also be unable to report abuse.
What are the risk factors?
While elder abuse can happen to anyone, certain factors can exacerbate a person’s risk of experiencing or perpetrating elder abuse (Box 2).
International literature provides evidence about risk factors for experiencing and perpetrating elder abuse.
Factors which heighten the risk of experiencing elder abuse include:
- poor physical or mental health
- substance misuse
- functional dependence/disability
- problems with stress and coping
- attitudes such as self-blame and stoicism
- previous experiences of abuse
- high-conflict relationships
- social isolation (Schofield and Mishra 2003; Storey 2020; WHO 2022).
Factors associated with perpetrating elder abuse include:
- poor physical and mental health
- substance misuse problems
- dependency on the victim
- holding negative attitudes such as ageism or resentment of the older person
- a history of conflictual or violent relationships
- social isolation
- experience of stressful events
- a history of family violence (Storey 2020; WHO 2022).
Elder abuse follows similar gendered patterns as other forms of family and domestic violence, albeit to a lesser extent. A 2017 review, found that there is a greater likelihood for women being abused (17%) than men (11%) (Ho et al. 2017). Sons are also more likely to perpetrate abuse than daughters (Kaspiew et al. 2015).
Long-term health impacts
Elder abuse can have serious physical and mental health, financial, and social consequences. These include physical injuries, premature mortality, depression, cognitive decline, financial devastation and placement in nursing homes (WHO 2022).
A 2017 systematic review demonstrated that older people who experience abuse are at higher risk of:
- physical health problems such as bodily pain, diabetes, weight problems, digestive problems, incontinence, allergies and disability
- psychological problems such as depression, negative emotions, anxiety, stress, suicidal ideation, attempted suicide and sleeping problems
- social dysfunction
- increased hospitalisation, visits to emergency department and use of behavioural health services (Yunus et al 2017).
What national data are available to report on elder abuse?
Data are available across a number of surveys and administrative data sources to look at the prevalence, consequences and outcomes of elder abuse, and the responses to it.
- ABS Personal Safety Survey (PSS)
- ABS Recorded Crime – Victims
- AIFS National Elder Abuse Prevalence Study
- AIHW National Hospital Morbidity Database
- AIHW Specialist Homelessness Services (SHS) data collection
- ANROWS Technology-Facilitated Abuse National Survey
- Serious Incident Response Scheme
For more information about these data sources, please see Data sources and technical notes.
What do the data tell us?
1 in 6 people in Australia experience elder abuse
The 2021 AIFS National Elder Abuse Prevalence Study collected information about elder abuse experienced by older people who live in the community in Australia. This nationally representative prevalence study surveyed 7,000 older people in 2020 who were living in the community and had the capacity to engage in telephone interviews. Aged care residents or those with cognitive impairment were excluded. However, this is the best national data source at present.
For further information, see National Elder Abuse Prevalence Study- external site opens in new window.
The AIFS National Elder Abuse Prevalence Study (see Box 3) estimated that, in 2020:
- around 1 in 6 (598,000 or 15%) older people living in the community had experienced elder abuse in the past year
- 471,300 (12%) had experienced psychological abuse in the past year
- 115,500 (2.9%) had experienced neglect in the past year
- 83,800 (2.1%) had experienced financial abuse in the past year
- 71,900 (1.8%) had experienced physical abuse in the past year
- 39,500 (1.0%) had experienced sexual abuse in the past year
- a slightly higher percentage of women than men had experienced any form of elder abuse in the past year. This pattern was also evident for psychological abuse and neglect (Figure 1; Qu et al. 2021).
Figure 1: Prevalence of elder abuse in the past year
| Type of elder abuse | Women | Men | Persons |
|---|---|---|---|
| Any form of abuse | 15.9% | 13.6% | 14.8% |
| Financial abuse | 2.0% | 2.1% | 2.1% |
| Neglect | 3.5% | 2.2% | 2.9% |
| Physical abuse | 1.6% | 2.0% | 1.8% |
| Psychological abuse | 12.6% | 10.7% | 11.7% |
| Sexual abuse | 1.2% | 0.7% | 1.0% |
Notes:
- Weighted data.
- The difference between men and women was statistically significant for any form of abuse, neglect and psychological abuse.
For more information, see Data sources and technical notes.
Source:
AIFS National Elder Abuse Prevalence Study
|
Data source overview
More than 1 in 4 older people have experienced technology-facilitated abuse
Elder abuse can take many forms. When abuse is conducted via mobile, online and/or digital technologies, it is called technology-facilitated abuse (Powell et al. 2022). Technology-facilitated abuse can encompass many subtypes of abuse, including harassing behaviours, sexual violence and image-based sexual abuse, monitoring and controlling behaviours, and emotional abuse and threats (Powell et al. 2022).
Data on technology-facilitated abuse are available in a study from the Australian National Research Organisation on Women’s Safety which was released in 2022. This research study involved a nationally representative study of about 4,600 people, of whom about 1,200 were aged 65 years and older.
For further information, see Technology-facilitated abuse: Extent, nature and responses in the Australian community- external site opens in new window.
The Australian National Research Organisation on Women’s Safety (Box 4) estimated that:
- 1 in 3 (33%) people aged 65–74 years have experienced technology-facilitated abuse in their lifetime
- 1 in 4 (25%) people aged 75 years and over have experienced technology-facilitated abuse in their lifetime
- in both age groups (65-74 years and 75 years and over), men were more likely than women to have experienced technology-facilitated abuse in their lifetime (Powell et al. 2022).
For more information on technology-facilitated abuse, please see Stalking and surveillance.
3% of older women and 2% of older men had experienced sexual harassment in the last 12 months
The Australian Bureau of Statistics Personal Safety Survey (PSS; ABS 2023a) collects information on experiences of physical and sexual assault, family and domestic violence, economic and emotional abuse, stalking, sexual harassment and childhood abuse.
For further information, see Personal Safety, Australia- external site opens in new window.
The 2021-22 PSS (Box 5) estimated that:
- 69,600 women aged 65 years and over (3.2%) had experienced sexual harassment in the last 12 months (ABS 2023c).
- 75,500 men aged 55 years and over (2.2%) had experienced sexual harassment in the last 12 months. This estimate should be used with caution as it has a relative standard error of 25% to 50% (ABS 2023c).
- 17,300 women aged 55 years and over (0.5%), had experienced sexual violence in the last 2 years. This estimate should be used with caution as it has a relative standard error of 25% to 50% (ABS 2023d).
The latest available data for reporting on stalking experienced by older people is from the 2016 ABS Personal Safety Survey (ABS 2017). This survey estimated that 17,000 older women (0.9%) and 11,400 older men (0.7%) had experienced stalking in the last 12 months. These estimates should be used with caution as they have a relative standard error of 25% to 50%.
Perpetrators differ depending on the type of abuse
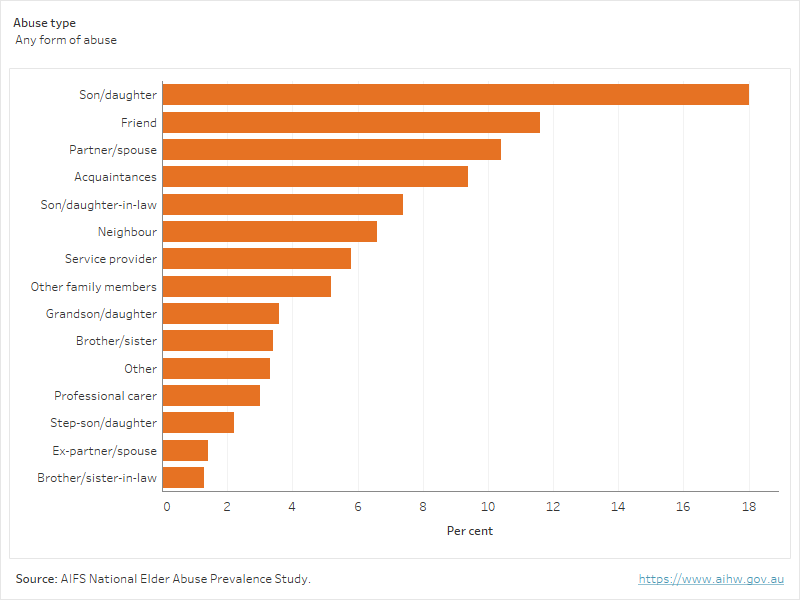
The 2021 AIFS study collected information on the perpetrators of elder abuse (Figure 2). While children were the most common perpetrators overall, patterns varied substantially depending on the type of abuse. For instance, psychological, financial and physical abuse were most often perpetrated by children of the older person, but there were almost no reports of sexual abuse perpetrated by children. A similar proportion of perpetrators of neglect were children (24%) and spouse/partners of the older person (25%) (Qu et al. 2021).
Around 1 in 2 (53%) perpetrators of elder abuse were family members (includes ex-partner/spouses). Perpetration by family members was highest for financial abuse (64%) then neglect (60%), psychological abuse (55%), physical abuse (50%) and sexual abuse (15%). Sexual abuse of older people was primarily perpetrated by friends (42%), acquaintances (13%) and neighbours (9%) (Qu et al. 2021).
Figure 2 explores the perpetrators of each type of elder abuse.
Figure 2. Relationship of perpetrators to older person (as % of perpetrators)
A bar chart shows the proportion of elder abuse perpetrators who had each type of relationship with the older person, disaggregated by the type of abuse.
Perpetrators were more likely to be male than female
The National Elder Abuse Prevalence Study (Qu et al. 2021) collected information about the characteristics of people who perpetrate elder abuse. This information was collected about the ‘main’ perpetrator for each older person who had experienced abuse, which was defined as the perpetrator who affected the older person the most. Note that these data include family as well as non-family perpetrators.
The AIFS study (Box 6) showed that main perpetrators were:
- more likely to be male (55%) than female (45%)
- more likely to be aged 65–74 (23%) or 45–54 years (20%) than any other age
- more likely to be unemployed (53%) than employed (47%)
- more likely to live apart from the older person (77%) than to live with them (23%) (Qu et al. 2021).
The majority (72%) of elder abuse victim-survivors indicated that their main perpetrator had one or more problems. The most common problems were mental health issues (32%), followed by financial problems (21%) and physical health problems (20%) (Qu et al. 2021).
What are the responses to elder abuse?
People who experience elder abuse may access many types of informal and formal supports such as family and friends, health professionals and helplines. Information on how victim-survivors seek help can assist understanding and improvement of response strategies. It can also provide information about the extent of under-reporting of elder abuse in data collected as a by-product of service delivery.
Help seeking
-
1 in 3 people
in 2021 who had experienced elder abuse had sought help from a third party
Source: AIFS National Elder Abuse Prevalence Study
Data on advice or support sought after elder abuse are available from the AIFS study. The study estimated that:
- 1 in 3 (36%) older people in Australia who experienced abuse sought help or advice from a third party such as a family member, friend or professional
- help seeking was most common after physical abuse, followed by psychological abuse, financial abuse, sexual abuse and then neglect
- of those seeking help, the most common sources of help were family members (41%) and friends (41%), followed by a GP or nurse (29%), a professional carer (24%), the police (17%) and lawyers (15%). Around 1 in 20 (5.3%) contacted a helpline (Qu et al. 2021).
Around 8 in 10 (82%) older people who experienced abuse had taken action to stop the abuse from happening again. These actions included informal actions (such as speaking to the person) and formal actions (such as seeking legal advice). The most common actions were speaking to the person or breaking contact with them.
Figure 3 explores help seeking or advice for each type of elder abuse.
Figure 3: Whether help or advice was sought by people who experienced elder abuse
| Type of elder abuse | Per cent |
|---|---|
| Sexual abuse | 23.6% |
| Psychological abuse | 39.8% |
| Physical abuse | 50.3% |
| Neglect | 20.2% |
| Financial abuse | 30.0% |
| Any form of abuse | 36.0% |
Notes:
- Weighted data.
- Percentages are of those who experienced each form of abuse.
- Where a participant experienced two or more forms of abuse, the report for each form was included in 'Any form of abuse'
For more information, see Data sources and technical notes.
Source:
AIFS National Elder Abuse Prevalence Study
|
Data source overview
Helplines contacts
Each state and territory in Australia has a telephone helpline for elder abuse (Box 7). These helplines are delivered by a government or non-government organisation in each jurisdiction, and provide confidential information, advice and referrals. Some states and territories publish data about the support services they provide, and these data can provide insight into instances in which elder abuse is identified or suspected.
1800 ELDERHelp was established in 2019 as a national, free call number which directs callers to a state or territory telephone service. The helplines are an important entry point into the service system for those in need of assistance. Callers may access the helplines via 1800 ELDERHelp or in other ways such as contacting the service directly.
Callers can be the victim-survivors of elder abuse or other people who are concerned about an older person. Currently, data are collected differently across states and territories in accordance with different definitions and operational processes. For this reason, data from helplines are not comparable between states and territories.
In 2021–22:
- the New South Wales helpline received 3,072 reports about abuse of older people (NSW ADC 2022)
- the Victorian helpline received 3,487 calls (COTA Victoria 2022)
- the Queensland helpline received 3,841 calls about abuse of older people. This included 2,338 abuse notifications and 1,503 enquiry calls (Gillbard and Leggat-Cook 2022).
- the Western Australian helpline received 1,330 calls (Advocare 2022)
- the South Australian helpline received 1,463 calls relating to older people (SA Health 2022).
Work is currently underway to harmonise the data collected across 1800 ELDER Help helplines to improve comparability. For more information about this work, see Key information gaps and development activities.
Police
Data on assaults which occur within the context of family and domestic violence in Australia are drawn from the ABS Recorded Crime – Victims collection. Note that these data do not include violence in non-family or domestic relationships such as that committed by a carer, service provider or stranger.
The ABS Recorded Crime – Victims collection also provides information on sexual assault crimes committed by family members, non-family members known to the victim, and strangers.
For further information, see Recorded Crime – Victims.
Some forms of elder abuse that are considered criminal offences under legislation are reported to, and recorded by, police. Data on crime rates make it possible to examine how police are engaged following incidents of violence, such as sexual assault, and violence that occurs in a family and domestic context.
In some cases, there is a delay in the reporting of a crime to police. Crime data can therefore be presented according to the victim’s age at the time of report or by their age at the time of the incident. This section presents data for victims of FDV-related assault who were aged 65 years and over at the time of report. Note that it does not necessarily refer to incidents of elder abuse (that is, violence that occurred while the person was 65 years and over).
Family and domestic violence-related assault
According to 2022 ABS Recorded Crime – Victims data (Box 8) (excluding Victoria and Queensland, see Data sources and technical notes), 37–51% of all assault victims aged 65 years and over at the time of report, were assaulted by a family member or domestic partner in 2022 (ABS 2023b).
The victimisation rate for family and domestic violence assaults (FDV assaults) in 2022 for those aged 65 years and over at the time of report was:
- around three times as high in the Northern Territory as in other states and territories
- higher for females than males in New South Wales, Western Australia, South Australia and the Northern Territory
- higher for males than females in the Australian Capital Territory and Tasmania (ABS 2023b).
Figure 4 shows the rates of FDV assault since 2014.
- The rate of FDV assaults reported in most states and territories remained relatively stable between 2014 and 2022, at 14–132 per 100,000 persons.
- The Northern Territory had the highest rate of FDV assaults reported to police in every year between 2014 and 2022, while Tasmania and the Australian Capital Territory had the lowest rates.
- The rate of FDV assaults reported in the Northern Territory increased sharply between 2019 and 2022 (ABS 2023b).
Figure 4: Victims of family and domestic violence-related assault, aged 65 years and over, by state, 2014–2022
| Period | New South Wales | Western Australia | South Australia | Tasmania | Australian Capital Territory | Northern Territory |
|---|---|---|---|---|---|---|
| 2014 | 78.5 | 71.8 | 59.2 | 20.8 | 26.4 | 161.4 |
| 2015 | 82.0 | 94.5 | 60.7 | 21.2 | 50.4 | 203.1 |
| 2016 | 84.7 | 108.5 | 73.9 | 14.4 | 44.4 | 212.3 |
| 2017 | 91.7 | 97.0 | 63.6 | 31.8 | 52.3 | 208.5 |
| 2018 | 86.1 | 93.8 | 70.1 | 24.0 | 46.7 | 208.0 |
| 2019 | 96.0 | 100.0 | 87.4 | 30.7 | 43.2 | 203.3 |
| 2020 | 100.5 | 109.9 | 88.2 | 34.3 | 46.7 | 295.8 |
| 2021 | 112.5 | 114.9 | 110.2 | 40.3 | 31.8 | 343.7 |
| 2022 | 119.5 | 131.9 | 110.3 | 38.5 | 57.9 | 373.0 |
Notes:
- Data have been randomly adjusted to avoid the release of confidential data and discrepancies may occur between sums of the component items and totals.
- Victims were aged 65 years and over at the time of report.
- Relationship of offender to victim data are not available for Western Australia. Inclusion here is based on FDV flag only.
For more information, see Data sources and technical notes.
Source:
ABS Recorded Crime - Victims (unpublished)
|
Data source overview
Sexual assault
The 2022 ABS Recorded Crime – Victims data show 114 male (5.5 per 100,000) and 380 (16.1 per 100,000) female victims of sexual assault aged 65 years and over at the time of report in 2022 (ABS 2023b).
Figure 5 presents the victimisation rate for sexual assault of people aged 65 years and older at the time of report in 2022 (excluding Western Australia), by offender type. It shows that:
- the highest victimisation rate (9.1 per 100,000) was for females by a non-family member who was known to them (for example, a neighbour or friend)
- females had a higher victimisation rate than males for each offender type
- for males and females, the victimisation rate for sexual assault perpetrated by non-family members was higher than by family members (ABS 2023b).
Figure 5: Victims of sexual assault aged 65 years and over (excluding Western Australia), by relationship of offender to victim, 2022
| Relationship | Females | Males | Persons |
|---|---|---|---|
| Family member | 3.3 | 0.4 | 2.0 |
| Non-family member (known to victim) | 9.1 | 4.2 | 6.7 |
| Stranger | 4.1 | 1.1 | 2.7 |
Notes:
- Data have been randomly adjusted to avoid the release of confidential data and discrepancies may occur between sums of the component items and totals.
- Victims were aged 65 years and over at the time of report.
- Family member includes partner, ex-partner and other family members.
- Relationship of offender to victim data are not available for Western Australia. Australia data for relationship of offender to victim is based on 7 states and territories (excluding Western Australia).
- 'Persons' includes victims for whom sex was not specified.
For more information, see Data sources and technical notes.
Source:
ABS Recorded Crime - Victims (unpublished)
|
Data source overview
The victimisation rate for FDV-related sexual assault among people aged 65 years and over at the time of the report increased slightly from 0.8 to 1.9 per 100,000 between 2014 and 2022, and was higher for females than males in every year (ABS 2023b).
Specialist homelessness services
Data on people seeking support from specialist homelessness services (SHS) are drawn from the AIHW Specialist Homelessness Services Collection. These services can provide assistance to people who are experiencing homelessness or who are at risk of homelessness, including clients who have experienced family and domestic violence. Examining the number of SHS clients who have experienced family and domestic violence provides an indication of the level of service response. The AIHW Specialist homelessness services annual report includes additional details on Clients who have experienced family and domestic violence.
Data on assistance provided by specialist homelessness services (SHS) (Box 9) show that:
- 5,400 females and 4,800 males aged 65 years and over accessed SHS in 2022-23
- 21% of females (1,100) and 3.8% (185) of males aged 65 years and over who accessed SHS in 2022-23 had experienced family or domestic violence
- since 2011–12, the proportion of females aged 65 years and over accessing SHS who had experienced FDV decreased from 33% in 2011–12 to 21% in 2022–23 (Figure 6)
- the proportion of males aged 65 years and over accessing SHS who have experienced FDV fluctuated between 2011–12 and 2022-23, ranging from 3.1% in 2013–14 and 5.9% in 2020–21, with 3.8% in 2022–23 (Figure 6; AIHW 2024).
Figure 6: Proportion of male and female specialist homelessness services clients aged 65 years and older who experienced FDV, 2011–12 to 2022–23
| Year | Females | Males |
|---|---|---|
| 2011-12 | 32.8% | 4.4% |
| 2012-13 | 29.0% | 3.6% |
| 2013-14 | 32.0% | 3.1% |
| 2014-15 | 34.7% | 4.0% |
| 2015-16 | 34.9% | 4.3% |
| 2016-17 | 35.9% | 4.2% |
| 2017-18 | 40.8% | 4.5% |
| 2018-19 | 34.0% | 3.5% |
| 2019-20 | 33.4% | 4.4% |
| 2020-21 | 33.2% | 5.9% |
| 2021-22 | 26.0% | 3.7% |
| 2022-23 | 20.9% | 3.8% |
Notes:
- 'Females' may also include clients recorded as 'other' sex as these data are combined for quality and confidentiality reasons.
- To minimise the risk of identifying individuals, a technique known as perturbation has been applied to randomly adjust cells. For this reason, discrepancies may occur between sums of the component items and reported totals, and data may not match other published sources.
For more information, see Data sources and technical notes.
Source:
AIHW SHSC
|
Data source overview
Hospitalisations
Some people who experience family and domestic violence require care from a health professional, and in some cases are admitted to hospital. Examining the hospitalisations for injuries caused by a family member or partner provides an indication of the demand for these services. However these data do not include presentation to emergency departments or primary care and so relate to more severe (and mostly physical) experiences of family and domestic violence. In addition, those who are hospitalised may choose not to reveal their experience of abuse, or the information may not be fully recorded. Data are drawn from the AIHW National Hospital Morbidity Database.
In 2021-22, about 160 women and 135 men aged 65 years and over were hospitalised for injuries related to family and domestic violence. Figure 7 shows that:
- overall, the rate of hospitalisations for injuries caused by a spouse or domestic partners was lower than by other family members
- women were more likely than men to be hospitalised for injuries caused by a spouse or domestic partner
- men were more likely than women to be hospitalised for injuries caused by another family member (AIHW 2023).
Figure 7: Family and domestic violence hospitalisations for people aged 65 years and over, by relationship to perpetrator, 2021–22
| Relationship | Female | Male | Total |
|---|---|---|---|
| Spouse or domestic partner | 2.8 | 1.8 | 2.4 |
| Other family member | 4.1 | 4.9 | 4.5 |
| FDV Total | 6.9 | 6.7 | 6.8 |
Notes:
- Age is age at admission.
- 'Persons' includes patients for whom sex was recorded as something other than 'male' or 'female'.
For more information, see Data sources and technical notes.
Source:
AIHW NHMD
|
Data source overview
Has it changed over time?
Some data are available to show how elder abuse has changed over time. These changes may reflect an actual change in the prevalence of elder abuse, an increase in awareness and propensity to report, or a combination of these factors.
Sexual assault in residential aged care
When unlawful sexual contact or inappropriate sexual conduct is detected within residential aged care facilities, providers must notify the Aged Care Quality and Safety Commission. The incident notifications are reviewed and assessed within 24 hours to ensure appropriate responses by providers including reporting to the police (Aged Care Quality and Safety Commission 2022c). Quarterly data on these notifications are available via the Serious Incident Response Scheme from October 2021.
Data from the Aged Care Quality and Safety Commission on reports of unlawful sexual contact or inappropriate sexual conduct in residential aged care facilities show:
- 530 reports between 1 October and 31 December 2021
- 485 reports from 1 January and 31 March 2022
- 452 reports between 1 April and 30 June 2022
- 633 reports between 1 July and 30 September 2022
- 565 reports between 1 October and 31 December 2022
- 592 reports between 1 January and 31 March 2023
- 519 reports between 1 April and 30 June 2023 (Aged Care Quality and Safety Commission 2021; 2022a; 2022b; 2022c; 2022d; 2023a; 2023b).
For more information, see Sector performance data | Aged Care Quality and Safety Commission.
Is it the same for everyone?
Older people in Australia are a diverse group, and experiences of violence and abuse can vary for a number of reasons. Data are available for selected groups of older people in Australia, but should be interpreted with caution due to small sample sizes.
Culturally and linguistically diverse (CALD) populations
The AIFS study provides information on the prevalence of elder abuse in Australia’s culturally and linguistically diverse (CALD) population. Note that these findings relate to the CALD population as a whole; conclusions about specific cultures or regions could not be drawn due to small sample sizes.
Key findings were that:
- A similar proportion of CALD (14%) and non-CALD (15%) participants had experienced elder abuse in the past year.
- Experiences of each type of abuse (except financial abuse) were similar for CALD and non-CALD participants. Financial abuse was less common for CALD (1.6%) than non-CALD (2.1%) participants.
- The experience of abuse was slightly higher for CALD women (14.2%) than CALD men (13.8%).
- Elder abuse decreased with age among the CALD sample (Qu et al. 2021).
Older people with disability or long-term health conditions
Around 50% of people in Australia aged 65 and over have disability (AIHW 2022). Some studies have suggested that older people with disability may be at increased risk of elder abuse (Storey 2020; WHO 2022). The AIFS study provides estimates of elder abuse for older people in the community who have disability or long-term health conditions. Note that the study excluded older people living in residential care facilities and those who lacked capacity to complete an interview.
The AIFS study shows that 21% of older people with disability or long-term health conditions had experienced elder abuse in the past 12 months (Qu et al. 2021). Older people with a disability or long-term health conditions experienced higher rates of every type of elder abuse than older people without disability or long-term health conditions (Qu et al. 2021).
Regional and remote areas
The AIFS study provides information on the prevalence of elder abuse in the past 12 months by geographic remoteness. Key findings were that:
- the prevalence of neglect was lower in Outer regional, Remote and Very remote areas (1.0%) than in Major cities (3.0%) and Inner regional areas (3.4%)
- the prevalence of financial, physical, psychological and sexual abuse were similar across levels of geographic remoteness (Qu et al. 2021).
More information
- Family, domestic and sexual violence in Australia: continuing the national story 2019
- Family, domestic and sexual violence data in Australia
- National sexual violence responses
- Family, domestic and sexual violence: National data landscape 2022
- Specialist homelessness services annual report
- National Hospital Morbidity Database
ABS (Australian Bureau of Statistics) (2017) Personal safety, Australia, ABS website, accessed 21 July 2022.
ABS (2018) Population projections, Australia 2017–2066. ABS website, accessed 21 July 2022.
ABS (2021) Population: Census, 2021. ABS website, accessed 3 July 2022.
ABS (2023a) Personal safety, Australia, ABS website, accessed 4 September 2023.
ABS (2023b) Recorded Crime – Victims, 2022, customised request, ABS.
ABS (2023c) Sexual harassment, ABS website, accessed 13 September 2023.
ABS (2023d) Sexual violence, ABS website, accessed 13 September 2023.
Advocare (2022) Annual report 2021–22, Advocare website, accessed 1 August 2022.
Aged Care Quality and Safety Commission (2021) 1 October – 31 December 2021 Sector performance data, Aged Care Quality and Safety Commission website, accessed 14 December 2022.
Aged Care Quality and Safety Commission (2022a) 1 January – 31 March 2022 Sector performance data, Aged Care Quality and Safety Commission website, accessed 14 December 2022.
Aged Care Quality and Safety Commission (2022b) 1 April – 30 June 2022 Sector performance data, Aged Care Quality and Safety Commission website, accessed 14 December 2022.
Aged Care Quality and Safety Commission (2022c) 1 July – 30 September 2022 Sector performance data, Aged Care Quality and Safety Commission website, accessed 6 February 2023.
Aged Care Quality and Safety Commission (2022d) 1 October – 31 December 2022 Sector performance data, Aged Care Quality and Safety Commission website, accessed 31 July 2023.
Aged Care Quality and Safety Commission (2023a) 1 January – 31 March 2023 Sector performance data, Aged Care Quality and Safety Commission website, accessed 31 July 2023.
Aged Care Quality and Safety Commission (2023b) 1 April – 30 June 2023 Sector performance data, Aged Care Quality and Safety Commission website, accessed 27 September 2023.
AIHW (Australian Institute of Health and Welfare) (2022) People with disability in Australia, AIHW website, accessed 7 August 2023.
AIHW (2023) AIHW analysis of the National Hospital Morbidity Database.
AIHW (2024) Specialist Homelessness Services Collection data cubes 2011–12 to 2022–23, AIHW, Australian Government, accessed 13 February 2024.
ALRC (Australian Law Reform Commission) (2017) ‘Elder abuse – a national legal response’. ALRC Report 131, accessed 21 September 2022.
COTA (Council on the Ageing) Victoria (2022) COTA Victoria 2021–2022 review, COTA Victoria website, accessed 20 March 2023.
Gillbard A and Leggatt-Cook C (2022) Elder abuse statistics in Queensland: Year in review 2021–22. Elder Abuse Prevention Unit website, accessed 20 March 2023.
Ho C, Wong S and Ho R (2017) ‘Global analysis of elder abuse: A meta-analysis and meta-regression’. East Asian Archives of Psychiatry, 27:43–55.
Joosten M, Vrantsidis F and Dow B (2017) Understanding elder abuse: A scoping study, University of Melbourne and the National Ageing Research Institute, accessed 6 September 2022.
Kaspiew R, Carson R, and Rhoades H (2015) ‘Elder abuse: Understanding issues, frameworks and responses’, AIFS research report, accessed 7 March 2022.
NSW ADC (Ageing and Disability Commission) (2022) NSW Ageing and Disability Commission 2021-22 annual report, NSW ADC, NSW Government, accessed 20 March 2023.
Powell A, Flynn A and Hindes S (2022) ‘Technology-facilitated abuse: National survey of Australian adults’ experiences’. ANROWS research report 12/2022, accessed 6 September 2022.
Qu L, Kaspiew R, Carson R, Roopani D, De Maio J, Harvey J and Harsfall B (2021). ‘National elder abuse prevalence study final report’. AIFS research report, accessed 7 February 2022.
SA Health (2022) South Australian Adult Safeguarding Unit annual report 2021–22, SA Health, Government of South Australia, accessed 20 March 2023.
Schofield MJ and Mishra GD (2003) ‘Validity of self-report screening scale for elder abuse: Women’s Health Australia Study’. The Gerontologist, 43(1):110–120, doi:10.1093/geront/43.1.110.
Storey JE (2020) ‘Risk factors for elder abuse and neglect: A review of the literature’, Aggression and Violent Behaviour, 50:101–339, doi:10.1016/j.avb.2019.101339.
WHO (World Health Organisation) (2022) Abuse of older people. WHO website, accessed 17 July 2022.
Yon Y, Mikton CR, Gassoumis ZD and Wilber KH (2017) ‘Elder abuse prevalence in community settings: A systematic review and meta-analysis’, The Lancet Global Health, 5(2):E147–E156, doi:10.1016/S2214-109X(17)30006-2.
Yon Y, Ramiro-Gonzalez M, Mikton CR, Huber M and Sethi D (2018) ‘The prevalence of elder abuse in institutional settings: A systematic review and meta-analysis’, European Journal of Public Health, 29(1): 58–67, doi:10.1093/eurpub/cky093
Yunus, RM, Hairi NN and Choo WY (2017) ‘Consequences of elder abuse and neglect: A systematic review of observational studies’, Trauma, Violence and Abuse, 20(2):197-213, doi:10.1177/1524838017692798.
- Previous page Mothers and their children
- Next page People with disability