Aboriginal and Torres Strait Islander people

In 2021–22, Aboriginal and Torres Strait Islander Australians accounted for 18% (23,746) of people aged 10 and over receiving treatment or support for their own or someone else’s alcohol or other drug use (Table SCR.26).

Nationally, the rate of Indigenous Australian people receiving treatment remains high:

  • in 2021–22, the crude rate of Indigenous Australians receiving treatment for alcohol or drug use was 3,420 per 100,000 people
  • the rate of Indigenous Australians receiving treatment for alcohol or drug use has increased over time, from 2,829 per 100,000 people in 2013–14 to 3,420 in 2021–22 (crude rate for clients aged 10 and over)
  • in 2021–22, Indigenous Australians were more than 7 times as likely to receive treatment for alcohol or drug use as non-Indigenous Australians after adjusting for differences in age structure (3,354 per 100,000 people compared with 497 per 100,000; age standardised rates for clients aged 10 and over) (Figure INDIGENOUS 1, Table SCR.26).

Figure INDIGENOUS 1: Estimated number and rate of clients, by Indigenous status, 2013–14 to 2021–22

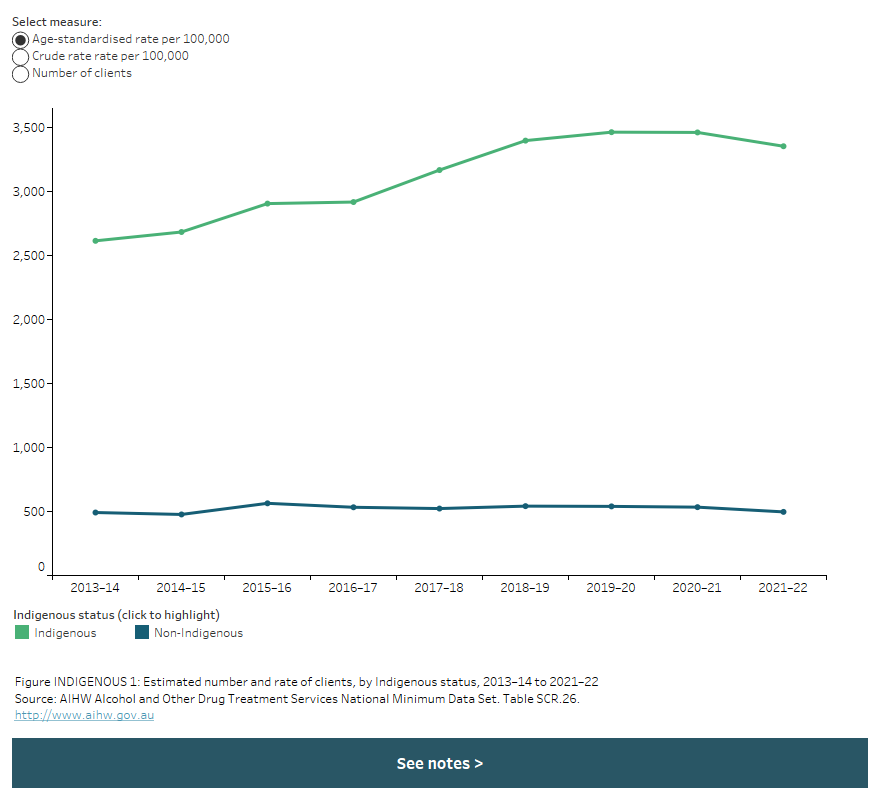
The line graph shows that between 2013–14 to 2021–22, the age-standardised rate of clients was consistently higher for Indigenous Australians than non-Indigenous Australians. In 2021–22, the age-standardised rate of clients was 3,354 per 100,000 population for Indigenous Australians, compared with 497 per 100,000 for non-Indigenous Australians. A filter allows the user to view data for age-standardised rate, crude rate or number of clients.


Client profile

In 2021–22:

  • just under 1 in 5 (18% or 22,338) people who received treatment for their own alcohol or drug use were Indigenous Australians aged 10 and over
  • around 1 in 10 (9.4% or 831) people who sought treatment for someone else’s alcohol or drug use were Indigenous Australians
  • three in 5 (60%) Indigenous clients were male and just under 2 in 5 (39%) were female
  • over 7 in 10 (72%) Indigenous clients were aged 10 to 40 years
  • Indigenous status was not reported for 3.1% of clients (Figure INDIGENOUS 2, tables SC.8–SC.10).

Figure INDIGENOUS 2: Proportion of Indigenous Australians by sex and age group (10 years and over), 2021–22

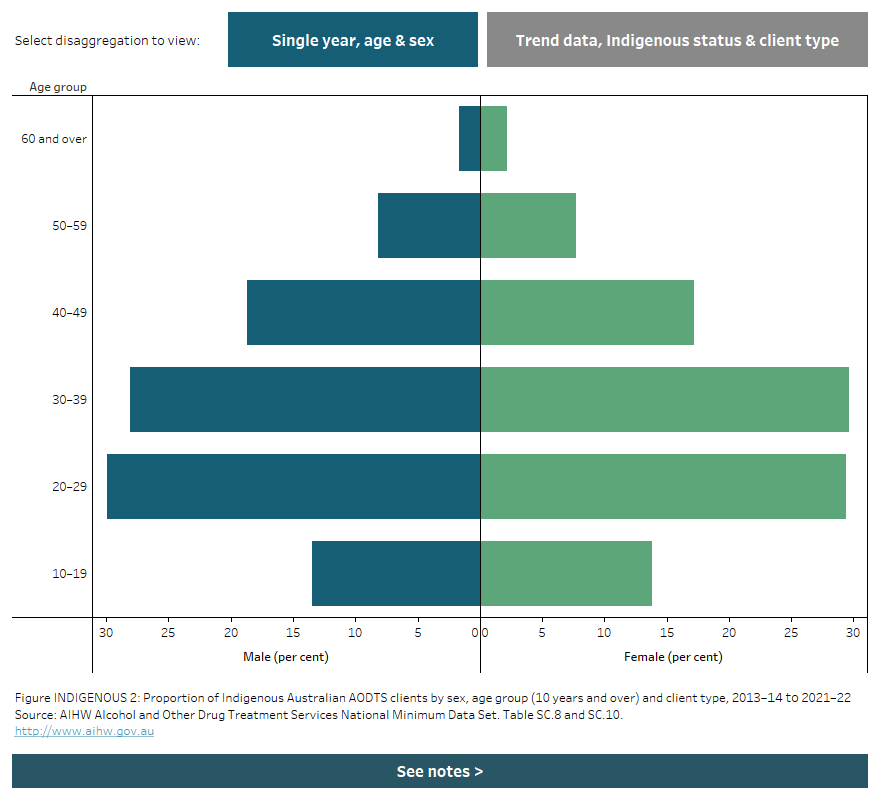
The butterfly bar chart shows that the most common age group for both male and female Indigenous Australian clients in 2021–22 was 20–29 (30% of both males and females), followed by 30–39 (28% of males and 30% of females). Buttons allow the user to navigate to a stacked bar chart presenting trend data disaggregated by Indigenous status and client type.


Principal drug of concern

The main principal drugs of concern that led Indigenous Australians to seek treatment were alcohol (36%), amphetamines (24%), cannabis (24%), heroin (4.9%) (Figure INDIGENOUS 3, Table SC.14).

Nationally, the crude rate of Indigenous Australians receiving treatment for alcohol decreased from 1,299 per 100,000 people in 2013–14 to 1,255 in 2021–22. Over the same period, the rate of Indigenous Australians receiving treatment for amphetamines more than doubled, from 399 per 100,000 people to 905 per 100,000 people.

In 2021–22, after adjusting for differences in age-structure, Indigenous Australians were:

  • nine times as likely to receive treatment for heroin (age standardised rate ratio) as non-Indigenous Australians (202 per 100,000 compared with 22 per 100,000)
  • seven and 8 times as likely to receive treatment for alcohol or amphetamines (respectively) as non-Indigenous Australians
  • seven times as likely to receive treatment for cannabis as non-Indigenous Australians (Figure INDIGENOUS 3, Table SCR.26).

Figure INDIGENOUS 3: Proportion and rate of Indigenous Australian AODTS clients, by principal drug of concern, 2013–14 to 2021–22

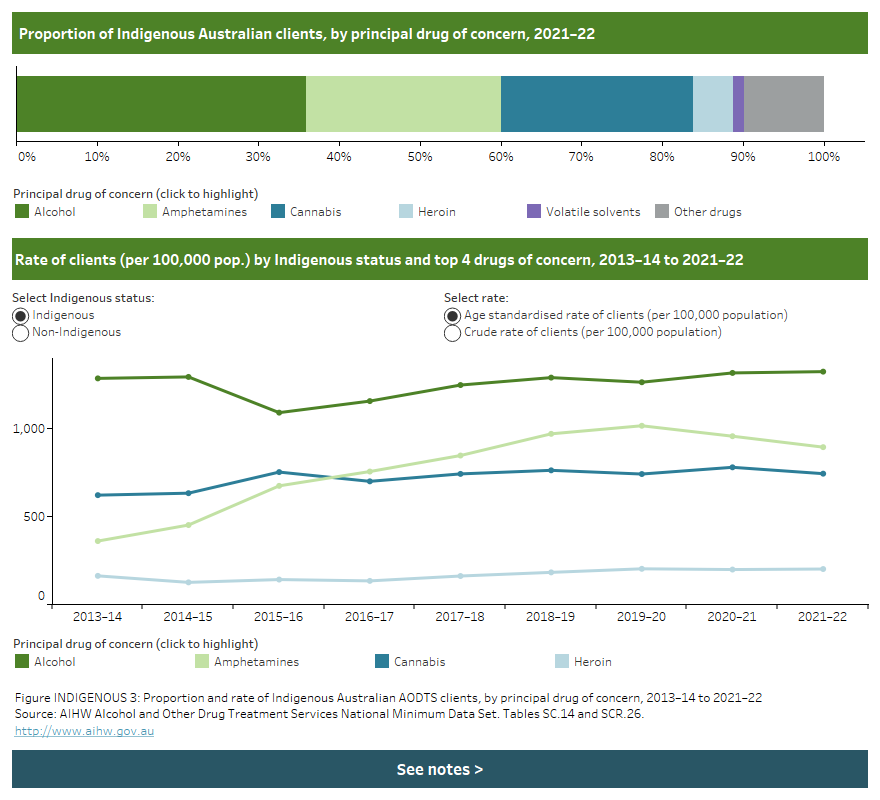
The visualisation includes 2 charts. The top chart is a stacked horizontal bar chart that shows the most common principal drug of concern among Indigenous Australian clients in 2021–22 was alcohol (35.9%), followed by amphetamines (24.2%). The bottom chart is a line chart that shows that alcohol has remained the most common principal drug of concern among Indigenous Australian clients across the period 2013–14 to 2021–22. Two filters for the bottom chart allow the user to view data for Indigenous or non-Indigenous clients and as a crude or age-standardised rate.


Main treatment

For the 22,338 Indigenous Australians receiving treatment for their own alcohol or drug use, counselling was the most common main treatment type (42%), followed by assessment only (22%). Similarly, for Indigenous Australians seeking treatment for another person’s alcohol or drug use, counselling was the most common treatment type (36%), followed by support and case management (33%; Table SC.20).

The referral and setting varied by treatment type for Indigenous Australian clients:

  • most referrals for Indigenous Australian clients into treatment were from a family member or a self-referral
  • Indigenous Australians who received withdrawal management (52%) or pharmacotherapy (61%) as a treatment type were most likely to be referred by a family member or a self-referral
  • over one-quarter (27%) of all referrals for Indigenous Australians into treatment were from a health service
  • the majority of Indigenous Australians received counselling (85%) or pharmacotherapy (94%) in a non-residential setting
  • just under three-quarters (73%) of Indigenous Australians received rehabilitation and over two-thirds (68%) received withdrawal management in residential settings (Figure INDIGENOUS 4 and INDIGENOUS 5, tables SC.23 and SC.24).

Figure INDIGENOUS 4: Proportion of Indigenous Australian AODTS clients, by main treatment type and referral source for all clients, 2021–22

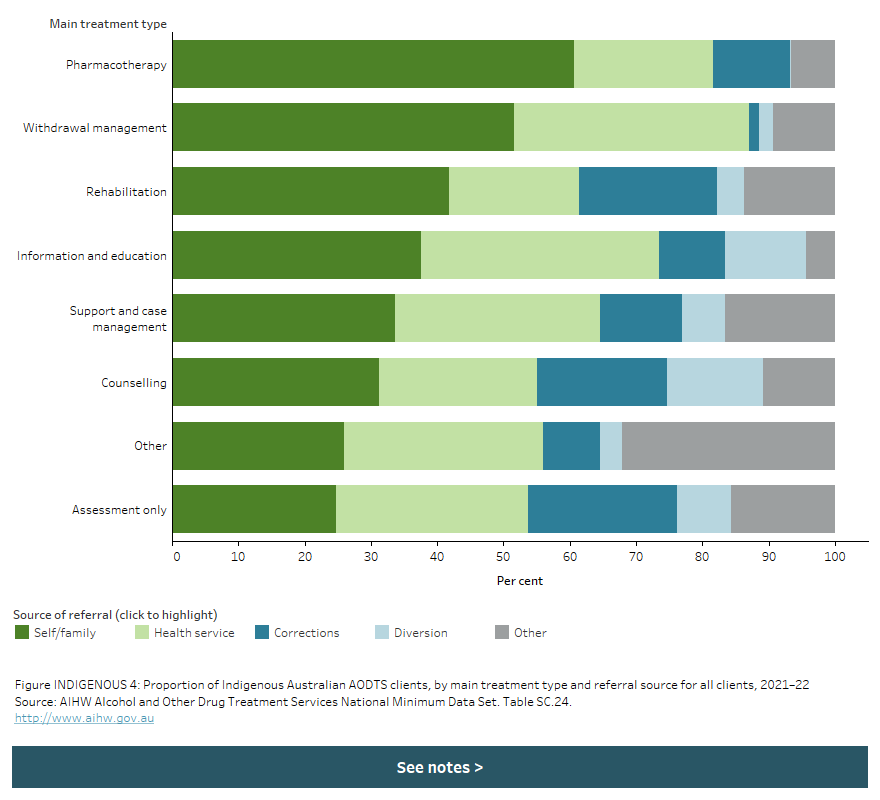
The stacked horizontal bar chart shows that the 2 most common sources of referral for Indigenous Australian AODTS clients were self/family and health service. This was consistent across all main treatment types. The proportion of clients who were referred via self/family ranged from 24.7% of clients receiving assessment only as the main treatment type to 60.6% for clients receiving pharmacotherapy. The proportion of clients who were referred via a health service ranged from 19.7% for clients receiving rehabilitation to 35.9% for clients receiving information and education.

Figure INDIGENOUS 5: Proportion of Indigenous Australian AODTS clients, by main treatment type and delivery setting for all clients, 2021–22

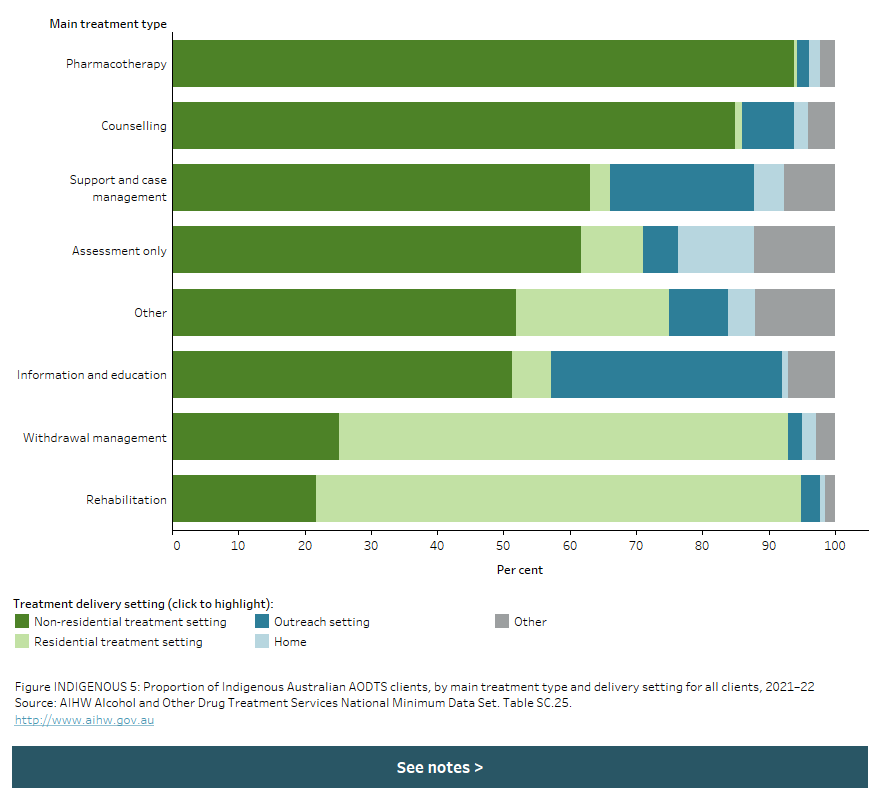
The stacked horizontal bar chart shows that non-residential treatment settings were the most common delivery setting among Indigenous Australian clients receiving counselling, support and case management, assessment only, pharmacotherapy, information and education, or ‘Other’ as the main treatment type in 2021–22 (ranging from 51.3% to 93.9% of clients). Residential treatment settings were the most common delivery setting for clients receiving withdrawal management or rehabilitation (67.7% and 73.1% of clients, respectively).


Australian Government-funded Aboriginal and Torres Strait Islander AOD reporting

The Australian Government funds primary healthcare services and substance use services specifically for Indigenous Australians. These services previously reported via the Australian Government-funded Aboriginal and Torres Strait Islander substance use services, via the Online Services Report (OSR) data collection. The substance use services program was transferred to the Department of Prime Minister and Cabinet and then to the National Indigenous Australians Agency and ceased in 2019.

The National Agreement on Closing the Gap noted that funding for First Nations Alcohol and Other Drugs (AOD) services and support will increase by up to $66 million to 2024–25, in addition to current funding. First Nations’ AOD Treatment Services funded under the Indigenous Advancement Strategy (IAS) currently assists around 75 providers to deliver 90 activities. The Commonwealth also provides AOD treatment services and prevention, research and communication activities through the Drug and Alcohol Program (DAP) and funding to Primary Health Networks (PHNs), with nearly 30% of PHN funding allocated for First Nations specific treatment services (National Indigenous Australians Agency 2022).