A different view of brain cancer rate changes over time
Cancer data commentary no. 4
Examination of brain cancer rate time series provides us with understandings of how brain cancer has been changing over time. Various brain cancer time series give the appearance that very little is changing over time. However, all may not be as it seems with brain cancer statistics. This commentary provides additional information that may refine conclusions about how brain cancer rates are changing over time.
Brain cancer incidence and mortality rates for people aged 80 or more increased substantially between 1982 and 1996
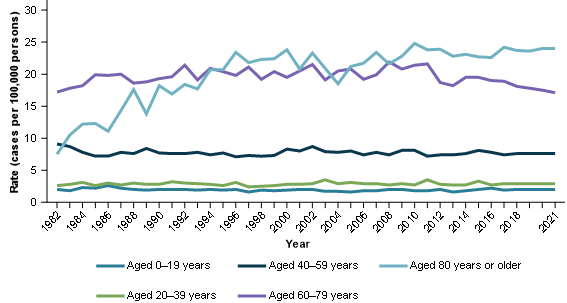
With the exception of the population aged 80 and over, brain cancer incidence rates by age groups have been relatively constant since 1982. For people aged over 80, the incidence rates have more than tripled between 1982 and 2021 (7.5 cases per 100,000 persons to an estimated 24 cases per 100,000 persons) with most of the change occurring prior to 1996 (Figure 1).
Figure 1: Age-specific incidence rates, brain cancer, by age group, persons, 1982 to 2021
Notes:
- Actual rates are provided between 1982 and 2017, 2018 and onwards are projections.
- 2017 rates include estimates for the Northern Territory and an estimate of late registrations for all other jurisdictions.
- 2016 rates include estimates of late registrations for the Northern Territory only.
Source: AIHW Australian Cancer Database 2017
Brain cancer mortality rates for people aged 80 and over have also increased substantially; these rates are estimated to have more than quadrupled between 1982 and 2021 (5.3 deaths per 100,000 persons to an estimated 23 deaths per 100,000 persons) (Figure 2).
Figure 2: Age-standardised mortality rates, brain cancer, by age group, persons, 1982 to 2021
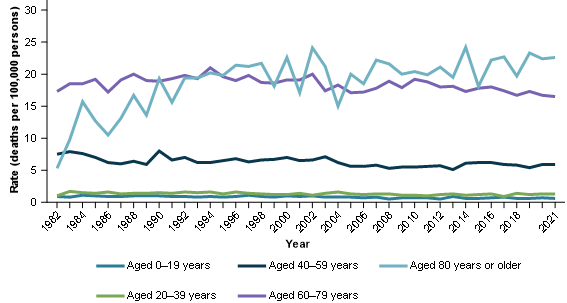
Note: Actual rates are provided between 1982 and 2019, 2020 and 2021 are projections.
Source: AIHW National Mortality Database
Why have the incidence and mortality rates for the older populations increased?
It has been suggested that the increasing rates of death from brain cancer for people older than 80 may not be genuine, rather brain cancers in the elderly were not diagnosed as often in earlier years. Increasing rates for the elderly began to occur with the availablity of more sophisticated, non-invasive diagnostic technology and changes in the attitude toward care for the elderly (Modan et al. 1992).
What do brain cancer incidence and mortality rates look like when adjusted for possible undercount?
The increase in brain cancer incidence in the elderly populations may be related to more aggressive diagnostic testing for this population (Legler et al. 1999) rather than brain cancer becoming more common in this population. Our interpretations of brain cancer rates today and how things have changed is based in part on comparisons with past rates. When we adjust time series for the possible historical under-diagnosis of brain cancer in the elderly, our understandings of brain cancer trends alters accordingly (particularly mortality trends).
Adjusting brain cancer age-standardised incidence and mortality rates for possible under-diagnosis
We have created a time series that aims to remove the potential under-diagnosis of the elderly in earlier years. Pre-1996 brain cancer incidence rates appear to be at most risk of reduced incidence and mortality rates arising from potential under-diagnosis. By using the 1996 incidence rates for the elderly and applying these age-specific rates to earlier years, we are able to derive adjusted age-standardised incidence rates; these rates provide an indication of the age-standardised rates without the possible under-diagnosis of the elderly. This same process has been used for mortality data.
We emphasise that the actual/raw rates represent the accurate rates of diagnosis and death as they were recorded at the time. The adjusted time series may provide a more comparable time series from which brain cancer trends may be better understood.
How do brain cancer incidence rates change over time when adjusted for possible under-diagnosis?
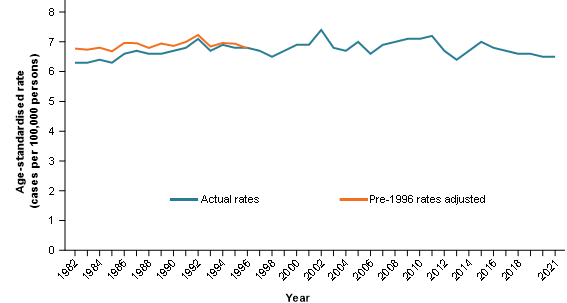
Figure 3 provides the actual and adjusted age-standardised brain cancer incidence rates from 1982 to 2021. Actual age-standardised incidence rates remain quite stable throughout time, as do the adjusted rates. The impact of adjusting incidence rates for possible under-diagnosis on how time series is interpreted is relatively limited. Its main impact for incidence may be to alter the possible interpretation that brain cancer age-standardised incidence rates were historically lower and that the occasional lower rates occurring in some more recent years have occurred in the past.
Figure 3: Age-standardised incidence rates and adjusted age-standardised incidence rates, brain cancer, persons, 1982 to 2021
Notes:
- Actual rates are provided between 1982 and 2017, 2018 and onwards are projections.
- 2017 rates include estimates for the Northern Territory and an estimate of late registrations for all other jurisdictions.
- 2016 rates include estimates of late registrations for the Northern Territory only.
- For 1982 to 1995, brain cancer rates for the population aged over 80 are adjusted to equal the 1996 rate of this population.
Source: AIHW Australian Cancer Database 2017
How do brain cancer mortality rates change over time when adjusted for possible under-diagnosis?
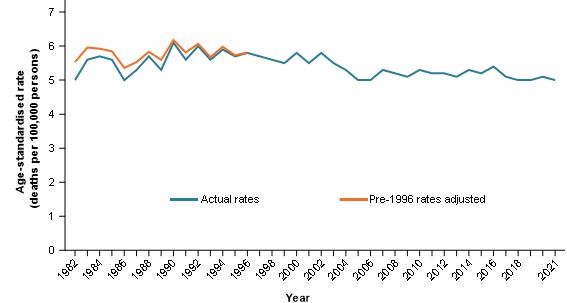
Actual age-standardised mortality rates for brain cancer suggest there is some volatility but overall little has changed over time. However, adjusted mortality rates more clearly show there has been a decrease in mortality rates. (Figure 4).
For mortality rates to have improved while incidence remained relatively stable, survival rates must have improved to some degree. This has occurred and is discussed in the next section.
Figure 4: Age-standardised mortality rates and adjusted age-standardised mortality rates, brain cancer, persons, 1982 to 2021
Notes:
- Actual rates are provided between 1982 and 2019, 2020 and 2021 are projections.
- For 1982 to 1995, brain cancer rates for the population aged over 80 are adjusted to equal the 1996 rate of this population.
Source: AIHW National Mortality Database
Brain cancer survival rates have changed more over time than it appears
Brain cancer 5-year relative survival rates appear to have increased by only 2 percentage points over a span of more than 20 years (20% in 1988–1992 to 22% in 2013–2017) (Figure 5). However, further analysis suggests that this time series is unlikely to satisfactorily capture the extent that brain cancer has really improved (which is discussed in detail in Cancer data commentary number 6 and briefly summarised below).
Figure 5: Five-year relative survival, persons, brain cancer, 1988–1992 to 2013–2017
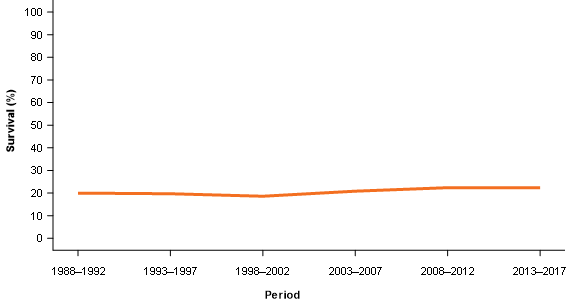
Source: AIHW Australian Cancer Database 2017
Why aren’t improvements in brain cancer relative survival being adequately captured?
Relative survival time series (all ages) across the different time periods are based on the survival for the entire population diagnosed with brain cancer for each of the relevant periods. The population aged over 80 has much lower survival rates than younger ages. Periods such as 1988–1992 include much smaller proportions of people aged over 80 than later periods. As time goes by, increases in brain cancer survival that have been occurring for most age groups which would normally also be apparent in the relative survival rate for all ages combined are being offset by the growing number of older people being diagnosed with brain cancer in later years.
When adjusting for age, brain cancer 5-year survival rates have doubled
When adjusting for age, the 2013–2017 brain cancer 5-year relative survival rate is effectively double that of 1988–1992 (11% to 22%). The actual 1988–1992 5-year relative survival rate of 20% is derived from a younger population of those diagnosed with brain cancer. If it had the same age characteristics as the population diagnosed in 2013–2017 the 5-year relative survival rate would have been 11% and not 20% (Figure 6). The age adjusted relative survival time series provides a more genuine reflection of changes in brain cancer survival outcomes over time.
Figure 6: Five-year relative survival and age-adjusted relative survival, brain cancer, persons, 1988–1992 to 2013–2017
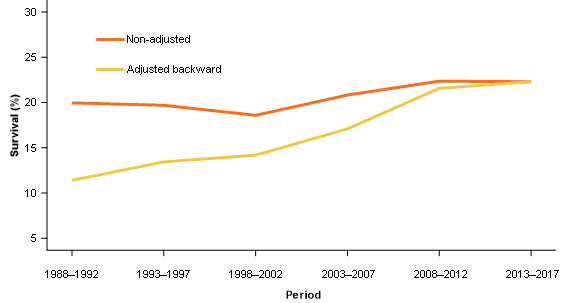
Note: The age composition in earlier periods are adjusted to equal the age composition of those diagnosed with brain cancer for the 2013–2017 survival period.
Source: AIHW Australian Cancer Database 2017.
Improvements in brain cancer survival have occurred for most age groups
Changes in brain cancer survival are better considered by viewing how survival rates have changed for each of the specific age groups.The population aged 20 to 39 has had the largest improvement in brain cancer 5-year survival rates between 1988–1992 and 2013-2017 (54% to 68%). For people aged 40 to 59, 5-year relative survival rates improved from 18% to 27% for the same period. Even though 5-year relative survival rates for people aged 60 to 79 remain low at 6.7%, this rate is double the rate of 3.1% in 1988–1992 (Figure 7).
Figure 7: Five-year relative survival, brain cancer, by age group, persons, 1988–1992 to 2013–2017
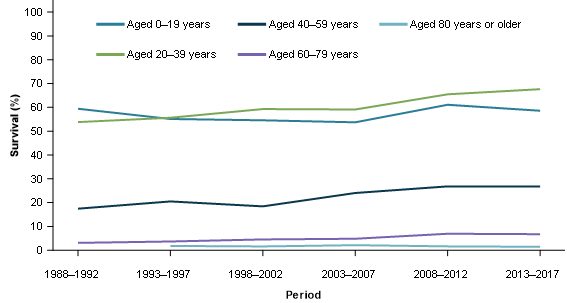
Source: AIHW Australian Cancer Database 2017
Improvements in survival are generally more evident for shorter survival periods (such as 2-year survival rates), particularly for cancers with relatively low survival rates such as brain cancer. These rates are available within the CdiA Survival by age data visualisation.
Concluding points
The incidence and mortality data adjusted for under-diagnosis appears to provide a more reasonable interpretation of brain cancer rates over time than the actual data. Relatively stable age-standardised incidence rates are accompanied by mortality data that is stable before decreasing. Decreases in mortality are likely to be driven by improvements in survival.
While there is some evidence supporting the under-diagnosis of the older populations in earlier years, it cannot be known with certainty. The age-adjusted mortality and incidence age-standardised rates presented are speculative of how rates would look assuming under-diagnosis of the elderly occurred in the past.
Actual age-standardised and crude incidence and mortality rates for brain cancer remain an accurate description of what was recorded in the relevant years and will therefore continue to be published in CdiA without adjustment. This commentary is intended to support interpretations of brain cancer data, but not replace the data recorded.
Brain cancer relative survival time series will continue to be published within CdiA. This data remains an accurate reflection of relative survival rates for the population diagnosed with brain cancer for the respective periods. These survival rates are now accompanied by the age-adjusted tool which is used to identify whether changes in survival rates are being impacted by changes in the age of those diagnosed with cancer across time.
CdiA now includes survival rates by 20 year age groups over time. These data provide further insights into cancer survival over time and provide important information for all cancers.