Cancer summary data visualisation
For many different cancers, this data visualisation provides a wide range of cancer-related statistics that, together, present a summary of national cancer data and trends over time. Help with terms, and information about the data, is available by placing the mouse pointer over the icons found near the top of the page. Please note that cancer mortality data has in the past been included within this visualisation but is only included within the Cancer mortality by age groups visualisation and Cancer risk data visualisation for this year’s report due to complexities in reporting.
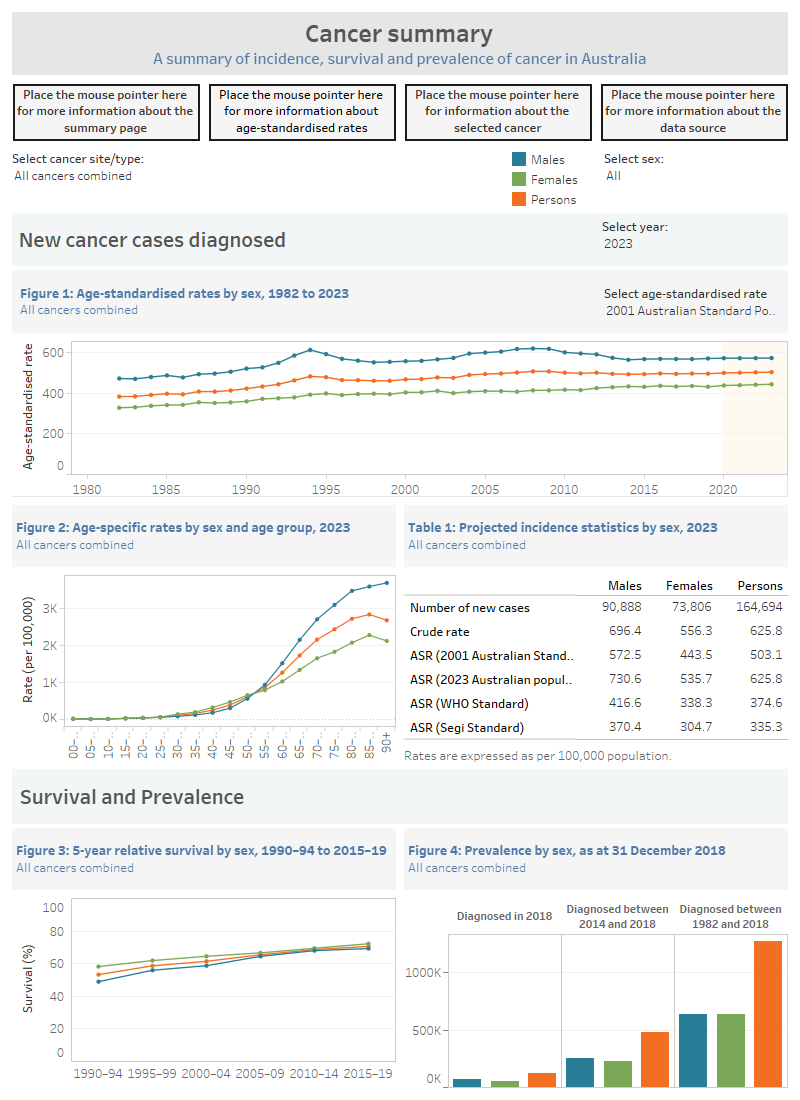
This cancer summary visualisation contains four figures and one table. The visualisation presents statistics for the selected cancer and provides statistics by sex.
Figure 1 is a line graph that contains information on the number of cancer cases and age-standardised rates of cancer diagnosis from 1982 to the most recent year available for reporting at the time of release.
Figure 2 is a line graph that contains information on the crude rate of cancer diagnosis for various 5-year age groups from 0–4, 5–9, etc. up to 90+ for a selected year between 1982 and the most recent year available for reporting at the time of release.
Table 1 contains cancer diagnosis-related summary statistics such as the number of cases, crude and age-standardised rate of diagnosis and mean and median ages at diagnosis.
Figure 3 is a line graph that contains 5-year relative survival rates for the selected cancer in 5-year periods.
Figure 4 is a column graph that contains information on cancer prevalence (that is, the number of people alive at specified point in time who have been diagnosed with the selected cancer previously).
The visualisation includes information about many different cancers and the statistics within this visualisation are available in Excel format within the Data section of this report.

Please note that cancer incidence statistics from 2020 to 2023 are projections; all other statistics are derived from actual data.
Data informing the summary dashboard is available as supplementary tables.
ABS (Australian Bureau of Statistics) 2018. Population projections, Australia, 2017 (base) – 2066. ABS cat. no. 3222.0. Canberra: ABS.
AIHW (Australian Institute of Health and Welfare) 2019. BreastScreen Australia monitoring report 2018. Cancer series no.127. Cat no. CAN 128. Canberra: AIHW
Al-Marhoon M, Osman A, Kamal M and Shokier A 2011. Incidental vs symptomatic renal tumours: Survival outcomes. Arab Journal of Urology 9(1): 17–21.
Brenner H and Gefeller O 1996. An alternative approach to monitoring cancer patient survival. Cancer78:2004–10.
Dickman PW 2004. Estimating and modelling relative survival using SAS. Stockholm: Karolinska Institutet. Viewed 26 May 2020.
Ederer F & Heise H 1959. Instructions to IBM 650 programmers in processing survival computations. Methodological note.
Greenwood M 1926. The errors of sampling of the survivorship table. Reports on public health and medical subjects. Vol 33. London: Her Majesty’s Stationery Office.
Jensen O, Parkin D, MacLennan R, Muir C & Skeet R (eds) 1991. Cancer registration: principles and methods. IARC scientific publications no. 95. Lyon: IARC.
Luke C, Tracey E, Stapleton A and Roder D 2010. Exploring contrary trends in bladder cancer incidence, mortality and survival: implications for cancer research and cancer control. Internal Medicine Journal 40:357–62.
Qaseem A, Usman N, Jayaraj J S, et al. (September 02, 2019) Cancer of Unknown Primary: A Review on Clinical Guidelines in the Development and Targeted Management of Patients with the Unknown Primary Site. Cureus 11(9): e5552. doi:10.7759/cureus.5552
Skuladottir H & Olsen JH 2003. Conditional survival of patients with the four major histologic subgroups of lung cancer in Denmark. Journal of Clinical Oncology 21(16):3035–40.
Smith D Supramaniam R, Marshall V and Armstrong B 2008. Prostate cancer and prostate specific antigen testing in New South Wales. Medical Journal of Australia 189(6): 315–18.
Vaccarella S, Franceschi S, Bray F, Wild C, Plummer M and Dal Maso L 2016. The increase in thyroid cancer may be due to an increase in medical surveillance and the introduction of new diagnostic techniques, such as neck ultrasonography. The New England Journal of Medicine 375: 614–17.