Expanded blood cancer reporting and the blood cancer reporting framework
Cancer data commentary number 10
The 2023 release of the Cancer data in Australia report (CdiA) includes more detailed blood cancer reporting than available in previous releases of the report. The greater range of data allows an increased depth of understanding of blood cancer statistics within Australia and provides survival and incidence information about types of blood cancer which have not been reported within CdiA in the past. This commentary helps users understand the expanded range of blood cancer statistics and complexities that may need to be considered when using this finer level data.
Blood cancer reporting used in the 2022 Cancer data in Australia report
Table 1 shows the blood cancers that were reported within the 2022 release of the CdiA. The blood cancer reporting used the International Classification of Diseases 10th Revision (ICD-10) codes to define the cancers and cancer groups.
| Cancer | ICD-10 |
|---|---|
| Lymphoma | C81 to C86 |
| Hodgkin lymphoma | C81 |
| Non-Hodgkin lymphoma | C82 to C86 |
| Immunoproliferative cancers | C88 |
| Multiple myeloma | C90.0 |
| Other plasma cell cancers | C90.1 to C90.9 |
| Leukaemia | C91 to C95 |
| Acute lymphoblastic leukaemia | C91.0 |
| Chronic lymphocytic leukaemia | C91.1 |
| Other and unspecified lymphoid leukaemia | C91.2 to C91.9, C94.7 |
| Acute myeloid leukaemia | C92.0, C92.3 to C92.8, C93.0, C94.0, C94.2, C94.4 to C94.5 |
| Chronic myeloid leukaemia (CML) | C92.1 |
| Other and unspecified myeloid leukaemia | C92.2, C92.9, C93.2, C93.7, C93.9 and C94.6 |
| Chronic myelomonocytic leukaemia (incl. juvenile) | C93.1 and C93.3 |
| Myeloproliferative neoplasms (excl. CML) | C94.1, D45, D47.1, D47.3 to D47.5 |
| Other blood cancers | C94.3 and C96 |
| Other and unspecified leukaemia | C95 |
| Myelodysplastic syndromes | D46 |
| All blood cancers combined | C81 to C96, D45, D46, D47.1, D47.3 to D47.5 |
The above list of blood cancers for 2022 includes the ICD-10 reporting for 2023.
Cancer data in Australia 2023 release - histology-based blood cancer reporting framework
In addition to the existing reporting, more detailed blood cancer statistics are also reported in this release. The cancers in the framework are defined in terms of histology codes from the second update of the third edition of the International Classification of Diseases for Oncology (ICD-O-3.2). The new blood cancer reporting framework has been developed in consultation with the Leukaemia Foundation’s Blood Cancer Taskforce. The AIHW thanks the Leukaemia Foundation and its Blood Cancer Taskforce for their significant assistance and knowledge, without which the blood cancer reporting structure would not be available. The blood cancer reporting using the framework is available in the Blood cancer by histology data visualisation as well as Excel data.
Note that some of the cancers within the framework are also included in the ICD-10 reporting. Also, where incidence data are not provided for a cancer, there were no cases diagnosed in the reporting period. Where survival data for a cancer are not provided, there were insufficient case numbers to derive a reliable survival rate.
Experimental data
The statistics from the new framework are being released as experimental data. The methods to derive the incidence and survival statistics are not experimental. Rather, the ‘experimental’ description is used to denote the complexity of reporting data at very fine levels in conjunction with the potential for statistics to be impacted by the data environment at these fine levels, which is discussed below.
Improvements in diagnostic capabilities, the continuing evolution of blood cancer understandings, and differences in coding practices between jurisdictions all have the potential to impact on the precision of reporting and the interpretation of time series. These are complexities that have the potential to impact on the precision of incidence rates and counts and, to a lesser extent, survival rates.
Improvements in diagnostic capabilities
The technological ability to precisely identify types of cancer has improved over time. Improvements in precision of diagnosis of blood cancer can be seen by considering the use of histology codes for ‘vague’ diagnostic terms over time. For example, the graph below shows how the use of the code for the very vague term ‘lymphoma, not otherwise specified’ has changed since 1982. The graph shows the percentage of blood cancer cases that have been coded to this term over the period 1982–2019. In the earliest years this proportion was 6–7% whereas in the latest years it is around 1%.
Figure 1 Percentage of blood cancer cases coded to 'lymphoma NOS'
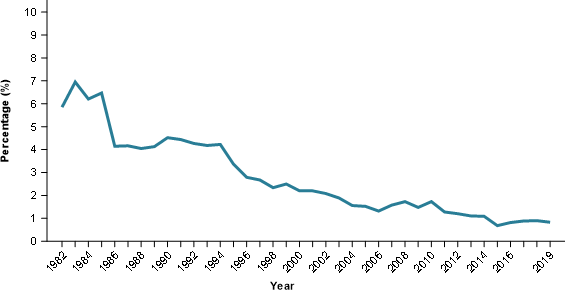
Source: AIHW 2019 Australian Cancer Database
As the use of histology codes for vague diagnostic terms decreases there is a corresponding increase in the use of codes for more specific diagnoses. Accordingly, increasing incidence rates for some cancers may be partly explained by this effect; that is, part of the increase may be due to improvements in the precision of the underlying data rather than being genuine increases in rates of that cancer in the community.
Histology based reporting involves diagnosis of the cell type, a finer level than cancer site. The new blood cancer framework reports on many cancers, many of which have comparatively small case numbers. Incidence rates for cancers with few cases may be subject to even greater uncertainty as small improvements in diagnostic capabilities may have proportionally large increases in incidence rates and counts. Broad groups such as ‘acute blood cancers’ and ‘chronic/mature blood cancers’ should have more reliable incidence and survival rates. These are less sensitive to improvements in diagnostic capabilities and are a more general level of diagnosis than most of the blood cancers already reported on.
While data from the Australian Cancer Database extends back to 1982, the blood cancer reporting in the new framework has only been undertaken for 2003 onwards. Improvements in diagnostic capability are likely to be much more apparent within an extended time series, noting that diagnostic capabilities in the 1980s are likely to be considerably lower than post 2000. The shorter time series released should be less influenced by improvements in diagnosis impacting on incidence rate change over time than would be the case for a longer time series.
Continuing evolution of blood cancer understanding
As the biological and medical understanding of blood cancer continues to improve, new cancer codes are introduced. When a new cancer type and code are introduced, some pathologists may start using the new terminology before others and some cancer registries may start using the code before others. What may appear in the data as the sudden emergence of a new cancer with increasing rates can be interpreted as the gradual uptake of the terminology by pathologists and use of the code by cancer registries.
In some cases when a cancer code is introduced some historical records may be updated to reflect the more precise and up-to-date diagnosis. This improves the information at a case level but impacts the comparability of time series both for the new cancer code and the code it was previously assigned.
Differences in coding practices between jurisdictions and complexity of the subject matter
State and territory cancer registries receive notifications of all blood cancers diagnosed in Australia. Coding practices between jurisdictions are fundamentally consistent but small differences may exist. For example, when a new code is introduced, jurisdictions may implement it at different times and practices about updating historical records may differ.
Using experimental data
The new blood cancer reporting framework uses a tiered structure. The tiers are used to group related cancers. Tier 1 is all blood cancers combined. Tier 2 comprises ‘acute blood cancers’, ‘chronic/mature blood cancers’ and ‘unclassifiable cancers’. Statistics for higher tier cancers (for example tiers 1 and 2) are more reliable. This is primarily due to the more general level of diagnosis required to classify these cancers and the generally greater number of cases where improvements in diagnosis have a minimal impact on the interpretation of incidence rates. The unclassifiable cancers group is an exception to this as decreasing incidence rates may be due to improvements in the precision of diagnosis.
Lower tier groups often have relatively few cases. A considerable risk in the interpretation of statistics is that a rare cancer may seem to be becoming more common within the Australian population whereas it may be more that diagnosis of the cancer has improved, or the cancer is newly recognised and rates are increasing as it is being recognised nationally.
The tiered structure can be used to identify whether general diagnosis (such as those terms ending with ‘NOS’ – not otherwise specified) could potentially materially contribute towards changing incidence rates. For example, declining incidence rates in one group may indicate increasing precision of diagnosis for other related cancers.
Some cancers have been introduced into reporting after 2003. The time series of incidence rates of these cancers are more likely to exhibit an increase in the several years after introduction due to the gradual take-up nationally of the cancer code in reporting.
Although incidence rates can be sensitive to factors like those discussed above, survival rates should be more robust. Even though not all cases of a particular cancer might be being assigned to a specific histology code, those which are being assigned to it are likely to be representative of all cases and therefore the survival rates for these will also be representative.
A key objective for the release of fine level cancer data is the provision of survival information for blood cancers that have previously not been reported on. Many of these have relatively few cases. Survival calculations depend on there being enough cases to derive a reliable survival statistic. To help achieve this, survival for a single 15-year period is available in addition to the three 5-year reporting periods. Using a 15-year period increases the number of cases that can be used in the calculations and increases the likelihood of a survival statistic being published.
When survival rates for 5-year periods are not available due to there being too few cases, the survival rate for the 15-year period provides at least some general understanding of survival for the cancer. However, it should be kept in mind that the latter is the composite of survival over a long period during which survival rates may have been changing. The survival rates for the 5-year periods are not comparable with the survival for the 15-year period. Instead, the 15-year period survival rates aim to provide some level of survival information about cancers where 5-year periods are not able to, and to provide some level of survival information for rare cancers.
Alignment of the blood cancer reporting framework with existing ICD-10 reporting
The new framework includes types of cancers which may be unfamiliar to those who predominantly use ICD-10 reporting structures. An incidence and survival data visualisation has been created which integrates the ICD-10 based reporting structure with the new ICD-O-3 based reporting structure. This visualisation helps display the relationships between the two structures and may help users understand the cancers at a more detailed level.