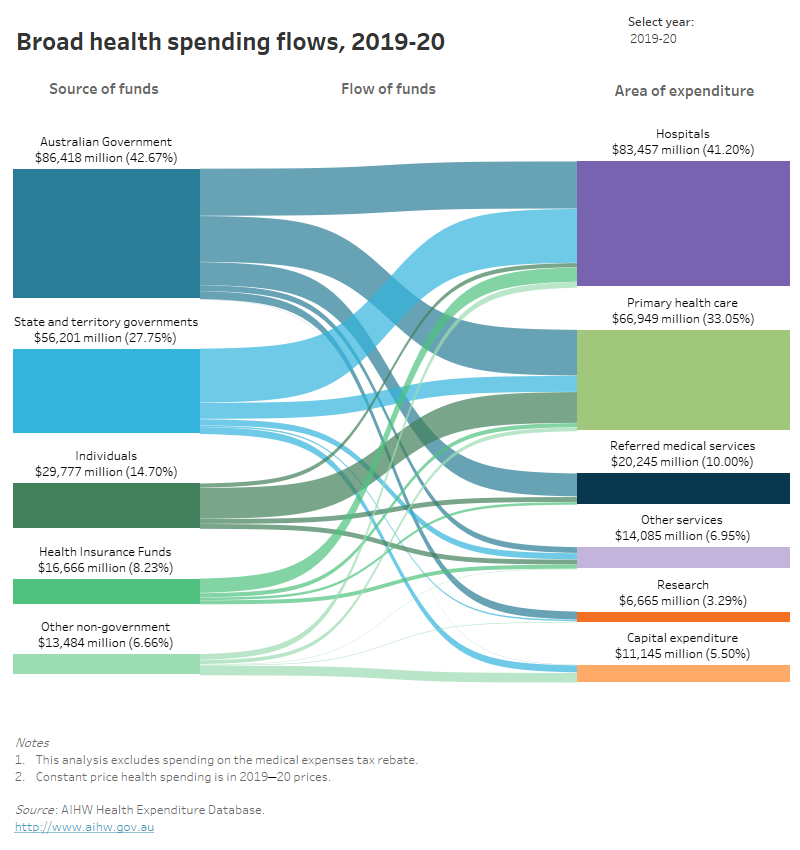
The ‘Broad flows’ figure shows diagrams on health spending flows in constant prices from sources of funds such as Australian Government, state and territory governments, Individuals, Health insurance funds and Other non-government into areas of expenditure: Hospitals, Primary health care, Referred medical services, Other services, Research and Capital expenditure. The diagrams cover the period from 1985–96 to 2019–20.
Health expenditure Australia 2019-20
Web report
Last updated:
Topic: Health & welfare expenditure
Citation
AIHW
Australian Institute of Health and Welfare (2021) Health expenditure Australia 2019-20, AIHW, Australian Government, accessed 26 April 2024.
APA
Australian Institute of Health and Welfare. (2021). Health expenditure Australia 2019-20. Retrieved from https://pp.aihw.gov.au/reports/health-welfare-expenditure/health-expenditure-australia-2019-20
MLA
Health expenditure Australia 2019-20. Australian Institute of Health and Welfare, 17 December 2021, https://pp.aihw.gov.au/reports/health-welfare-expenditure/health-expenditure-australia-2019-20
Vancouver
Australian Institute of Health and Welfare. Health expenditure Australia 2019-20 [Internet]. Canberra: Australian Institute of Health and Welfare, 2021 [cited 2024 Apr. 26]. Available from: https://pp.aihw.gov.au/reports/health-welfare-expenditure/health-expenditure-australia-2019-20
Harvard
Australian Institute of Health and Welfare (AIHW) 2021, Health expenditure Australia 2019-20, viewed 26 April 2024, https://pp.aihw.gov.au/reports/health-welfare-expenditure/health-expenditure-australia-2019-20
PDF | 6.7Mb
Newer release available