Health spending in each state and territory

Of total health spending in 2019–20, more than half (56.1%) was spent in New South Wales ($62.5 billion) and Victoria ($51.0 billion) combined. These states also represented more than half (around 58%) of the Australian population (Figure 3; Table 37).

From 2018–19 to 2019–20, growth in total spending ranged from –1.9% in Tasmania to 4.9% in the Australian Capital Territory (note that the decline in Tasmania was caused by a drop in capital expenditure, with recurrent expenditure increasing by 1.8% in 2019–20).

Figure 3: Total health expenditure for each state and territory, constant prices⁽ᵃ⁾, 2009–10 to 2019–20 

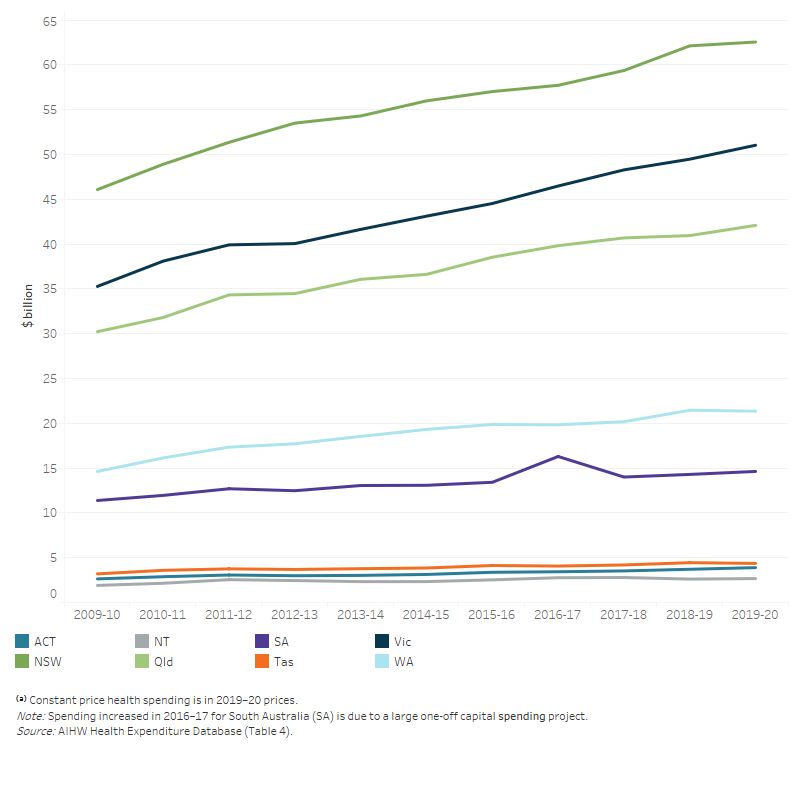
The line graph shows that total health spending was highest for New South Wales and lowest for the Northern Territory in the 10-year period. In 2019–20, total health spending was $62.5 billion for New South Wales and $2.7 billion for the Northern Territory. Total health spending increased between 2009–10 and 2019–20 for all states and territories.

In 2019–20, average per capita health spending was similar across all states and territories, except for the Northern Territory where average spending was $10,878 per person, compared with the national average of $7,926 (Figure 4).

Figure 4: Average total health expenditure per person⁽ᵃ⁾ for each state and territory, constant prices⁽ᵇ⁾, 2009–10 to 2019–20

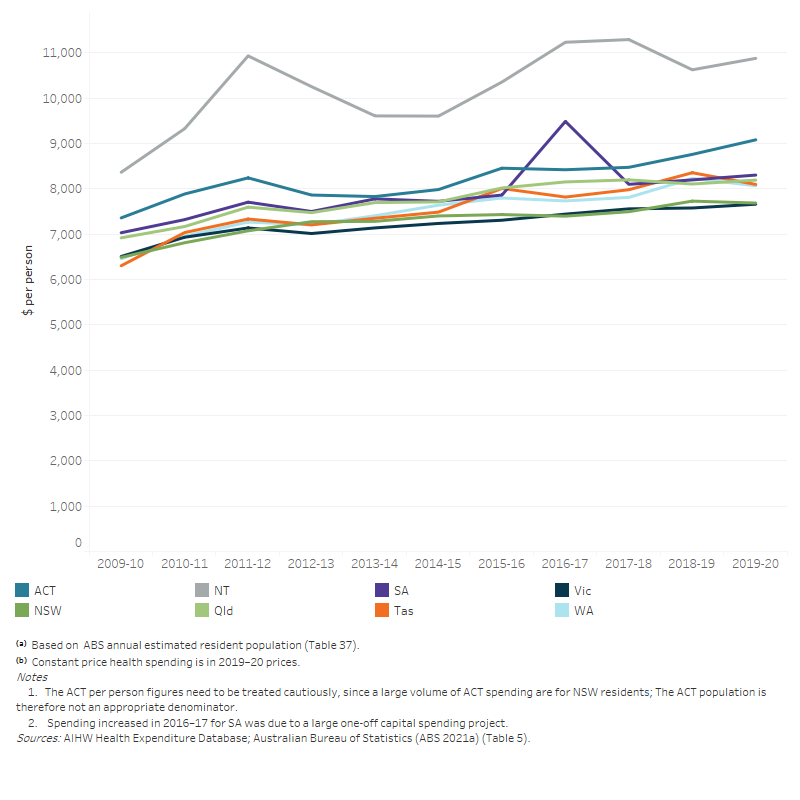
The line graph shows that average total health spending per person for each state and territory increased overall from 2009–10 to 2019–20. Australian Capital Territory is excluded from the graph, as the Australian Capital Territory population is not an appropriate denominator. In the 10-year period, Northern Territory maintained the highest average total health spending per person while the other states and territories recording similar values.