Client geography
Key findings
-
The highest rate of clients were in Western Australia - Outback (North) (576.0 clients per 10,000 population or around 5,600 clients) and Northern Territory - Outback (569.8 clients per 10,000 or 5,700 clients) regions.
-
The lowest rate of clients were in the Sydney - Baulkham Hills and Hawkesbury (15.7 clients per 10,000 population) and Brisbane – West (16.8 clients per 10,000) regions.
- In two-thirds of the regions, the majority of SHS clients (where housing situation and SA4 were known) were at risk of homelessness; in the remaining one-third of SA4 regions, the majority of clients in those regions were experiencing homelessness.
- The highest proportion of homeless clients was in the Perth – Inner (74%) region and the highest proportion of at risk clients was in the Sydney – Inner South West (79%) region.
In Australia, market changes can influence the availability of housing options within an area (Wood et al. 2014). Although the rate of homelessness is higher in remote areas, it is increasingly more common in areas with decreasing availability of affordable private renting and increasing overcrowding, such as major cities (Parkinson et al. 2019).
The rate at which people access Specialist Homelessness Services (SHS) can vary geographically due to varying service availability and region-specific factors such as housing availability and affordability. It is important to note that the rate of SHS clients is a measure of service response and does not necessarily reflect the total number of people in a local area in unstable housing situations.
This section provides an overview of the geography of clients supported by SHS clients across Australia based on the client’s location prior to receiving SHS support.
Identifying client location in the Specialist Homelessness Services Collection (SHSC)
This section examines people seeking SHS support based on where the person lived in the week before presenting to a SHS agency, as reported at the first support period during 2021–22. Clients are assigned to only one region for the financial year but may move to other regions for subsequent support periods. Also, the allocated location may not be a permanent address, for example, people who were couch surfing the week prior to seeking services may nominate the location of their temporary accommodation rather than their previous more permanent location. Client location is classified to Statistical Area 4 (SA4) based on the 2016 Australian Statistical Geography Standard (ASGS) (ABS 2016). A total of 88 SA4s are reported in this section, which excludes non-geographic codes and Other Territories. Please note that the Service geography analysis in this report is based on agency location. See Technical information for more details.
Geographic profile of SHS clients
In 2021–22, SHS agencies assisted nearly 272,700 clients across Australia. The rate of people receiving SHS services varied by region (Supplementary tables CLIENTLOC.1 and CLIENTS.1):
- The highest rate of SHS clients were in Western Australia - Outback (North) (576.0 clients per 10,000 population), higher than Western Australia and national rates (89.8 and 106.2 respectively).
- Across the other states and territories, the highest rates of SHS clients were in:
- New South Wales: Far West and Orana (282.0 clients per 10,000 population)
- Victoria: North West (304.8)
- Queensland: Queensland – Outback (284.1)
- South Australia: South Australia – Outback (225.7)
- Tasmania: Hobart (127.1)
- Northern Territory: Northern Territory – Outback (569.8)
- Australian Capital Territory (58.2).
- The 5 regions with the highest number of clients were located in Victoria:
- Melbourne – West (Victoria) (13,900 clients or 161.3 per 10,000 population)
- Melbourne - South East (9,400 clients, or 108.3 per 10,000 population)
- Melbourne – Inner (9,300 clients, or 148.2 per 10,000 population)
- Latrobe – Gippsland (7,300 clients, or 243.9 per 10,000 population)
- Melbourne - Outer East (7,200 clients, or 137.0 per 10,000 population).
Figure CLIENTLOC.1: Clients by age and sex, Statistical Area 4 (SA4), 2021–22
This interactive dashboard includes an interactive map of Australia that shows the number and rate per 10,000 population of clients in each of Australia’s Statistical Area 4 regions in 2021–22. The dashboard includes a vertical bar graph of the proportion of clients by age groups as well as two interactive horizontal bar graphs that further show the proportion of clients seeking services by sex and age group in the selected SA4 region, compared to the proportion of clients in Australia by sex and age group.
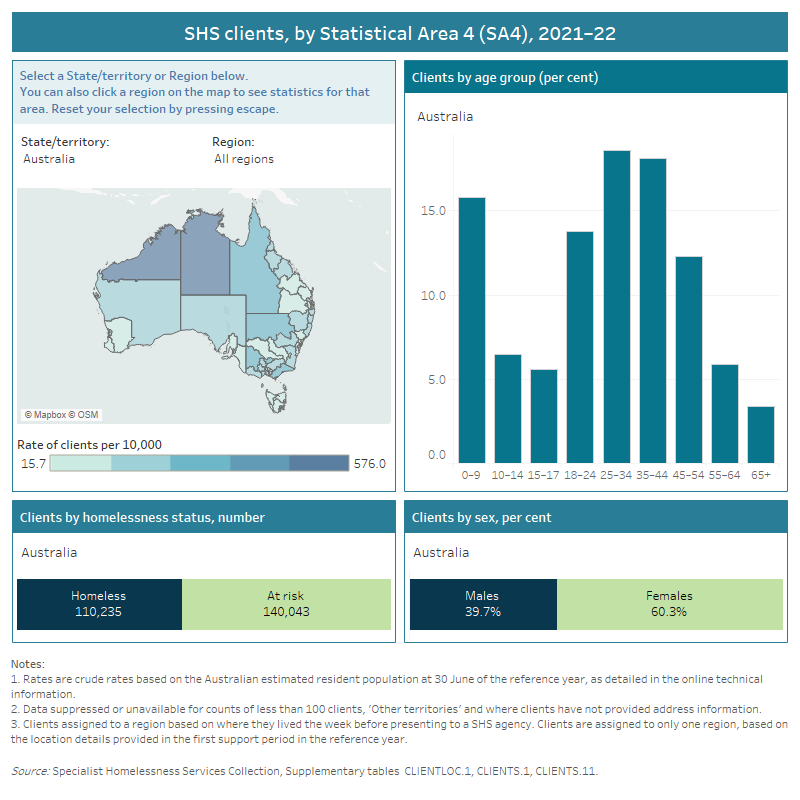
Of the 272,700 SHS clients in 2021–22, females made up the majority of clients; 60% or around 164,400 clients (Supplementary table CLIENTS.1). The location of male and female clients the week before presenting to a SHS agency varied (Figure CLIENTLOC.1):
- The highest proportion of female clients receiving services were in Western Australia – Wheat Belt and Bunbury; 77% and 75% respectively.
- Male clients made up the majority of clients in more urban areas of state capital cities with the highest proportion of males in Sydney - City and Inner South (53%).
The age profile of clients receiving SHS assistance also varied by geography across Australia in 2021–22 (Figure CLIENTLOC.1):
- The greatest proportion of child clients (aged 0 to 9 years) occurred in Sydney - Outer South West and Sydney - South West (both 28% of clients).
- The greatest proportion of young people (aged 15 to 24 years) occurred in Sydney – Sutherland (37% of clients) and Illawarra (34% of clients).
- The greatest proportion of older clients (65 years and over) occurred in South East (7.9% of clients) in Tasmania and Melbourne – North West (6.7% of clients)
Housing situation
Among clients whose housing status was known at the beginning of their first support period in 2021–22, around 110,200 clients presented homeless and 140,000 presented at risk of homelessness to SHS agencies (Supplementary table CLIENTS.11).
The proportion of homeless and at risk clients varied by geographic region (Figure CLIENTLOC.1):
- Clients presenting at risk of homelessness to a SHS agency made up the majority (more than 50% of clients where housing situation and SA4 was known) of clients in 60 SA4 regions.
- The highest proportion of clients presenting experiencing homelessness was in Perth - Inner (74% or 1,300 clients); the highest proportion of clients presenting at risk of homelessness was in Sydney - Inner South West (79% or 2,000 clients).
Australian Bureau of Statistics (July 2016) Australian Statistical Geography Standard (ASGS) Volume 1: Main Structure and Greater Capital City Statistical Areas, ABS website.
Parkinson S, Batterham D, Reynolds M and Wood G (2019) ‘The changing geography of homelessness: a spatial analysis from 2001 to 2016’, AHURI Final Report 313, Australian Housing and Urban Research Institute Limited, doi:10.18408/ahuri-5119601.
Wood G, Batterham D, Cigdem M and Mallett S (2014) ‘The spatial dynamics of homelessness in Australia 2001–11’, AHURI Final Report No.227, Australian Housing and Urban Research Institute Limited.