Clients, services and outcomes
Specialist homelessness agencies provide a wide range of services to assist people who are experiencing homelessness or who are at risk of homelessness, ranging from general support and assistance to immediate crisis accommodation. Characteristics of all clients assisted by specialist homelessness services (SHS) in 2021–22 are described below, including their need/s for assistance and the services they received.
Key findings: SHS clients, services and outcomes 2021–22
SHS clients at a glance
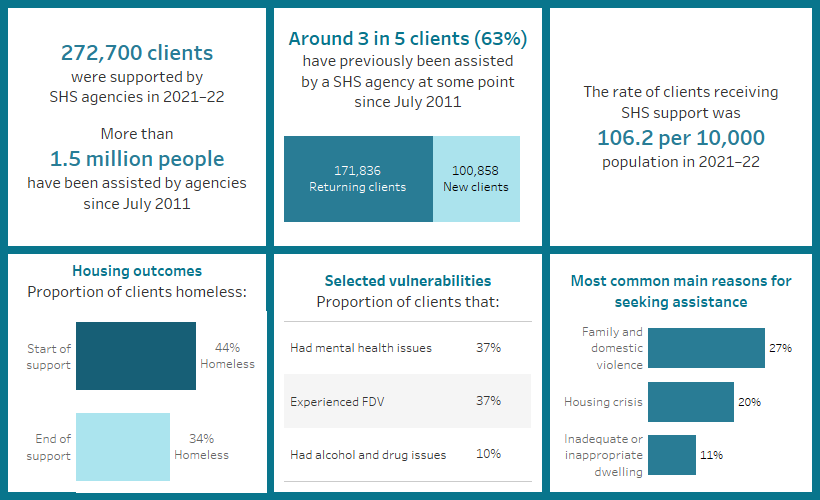
The number of clients assisted by specialist homelessness agencies increased to almost 272,700 in 2021–22 from 236,400 in 2011–12; an average annual increase of 1.4% since 2011–12. The rate of SHS clients increased from 105.8 clients per 10,000 population in 2011–12 to 106.2 clients in 2021–22 (Table HIST.CLIENTS).
It is important to note, the number of clients supported by Specialist Homelessness Services reflects the agency engagement of people which is not necessarily a reflection of the underlying level of homelessness in Australia.
Characteristics of clients
In 2021–22, 37% of SHS clients were first time clients since the collection began in July 2011.
The characteristics of clients, the main reasons for seeking assistance, and the services that had been supplied to clients, have remained relatively stable over the 5 years to 2021–22. Key insights include:
- The number of SHS clients with a current mental health issue increased; 85,200 (31% of all SHS clients) in 2021–22 compared with 81,000 (28%) in 2017–18. Since July 2011, the number of these SHS clients has increased at an average rate of 6.7% per year, the fastest rate of all SHS client groups. (Historical table HIST.MH).
- The number of SHS clients who have experienced family and domestic violence decreased; almost 107,700 (39% of all SHS clients) in 2021–22 compared with 121,100 (42%) in 2017–18 (Historical table HIST.FDV). This may partly be due to a change in how some family violence agencies in Victoria were recording FDV clients; see the Data quality statement for further information.
- The number of older SHS clients increased; over 25,300 (9.3% of all SHS clients) in 2021–22 compared with 24,100 (8.3%) in 2017–18. Since July 2011, the number of older clients has increased at an average rate of 5.9% per year (Historical table HIST.OLDER).
- Length of support provided to clients has increased, with the median number of days a client was supported increasing to 53 days in 2021–22 from 39 days in 2017–18 (Supplementary table CLIENTS.46).
- The number of females presenting homeless (58,400) was higher than the number of males (51,800) (Supplementary table CLIENTS.11).
Age and sex
Reporting sex in the Specialist Homelessness Services Collection (SHSC)
The additional category ‘Other’ was added to the question which records the person’s sex and applies to support periods and unassisted instances starting on or after 1 July 2019. Analysis of the updated 2021–22 sex of client data demonstrated some variable data quality and consistency of use among services. Consistent to the approach adopted for the 2020–21 Annual Report, for the 2021–22 Annual Report these clients were combined with the ‘Female’ category for reporting purposes only. For further information, please see the Technical Notes.
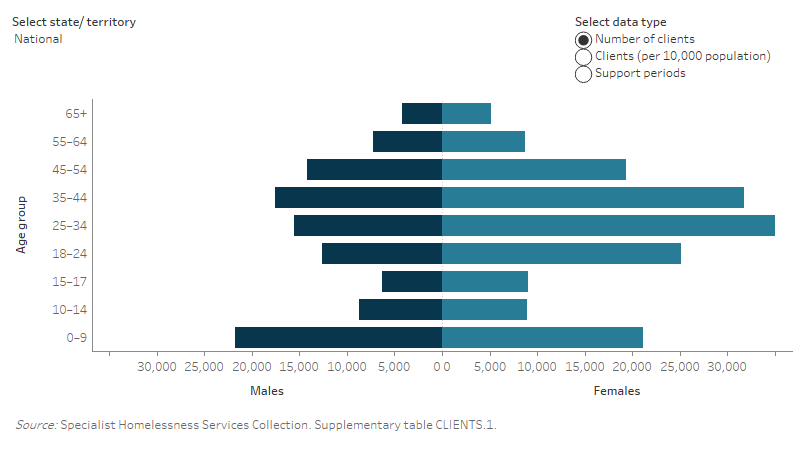
In 2021–22 (Figure CLIENTS.1):
- The majority of clients were female (60% or around 164,400 clients).
- 3 in 10 clients were aged under 18 (28% or 76,000).
- Among adult clients, the largest age group was those aged 25–34, accounting for almost 1 in 5 clients (19%), over two-thirds of whom were female.
- The overall rate of SHS clients was higher for females: 1 in 79 females in the Australian population received support compared with 1 in 118 males.
- The highest rate of clients among all age groups were those aged 18–24 years: higher for females (235.2 per 10,000 population) than for males (111.0).
- The lowest rate of clients was for those aged 65 and over (21.6 per 10,000 population): higher for females (22.4 per 10,000 population) than males (20.7).
Figure CLIENTS.1: Clients by age and sex, states and territories, 2021–22
This interactive horizontal population pyramid shows the marked differences between the age profiles of male and female SHS clients. Data are presented for the number of SHS clients, the rate of service use of SHS clients, and the number of support periods. Nationally, the highest numbers of male clients were aged 0 to 9 years while females aged 25–34 were the age group with the highest number.
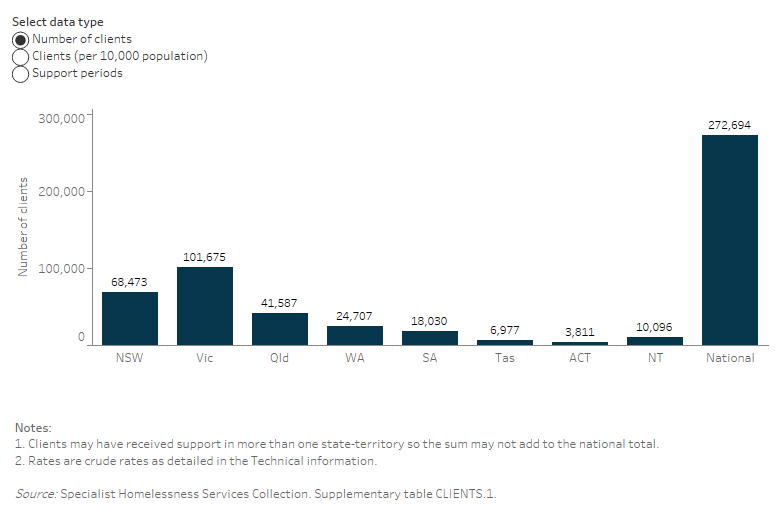
This interactive bar graph shows the number of SHS clients, the rate of service use of SHS clients, and the number of support periods, for each of the states and territories. The Northern Territory had the highest rate and Queensland had the lowest rate.
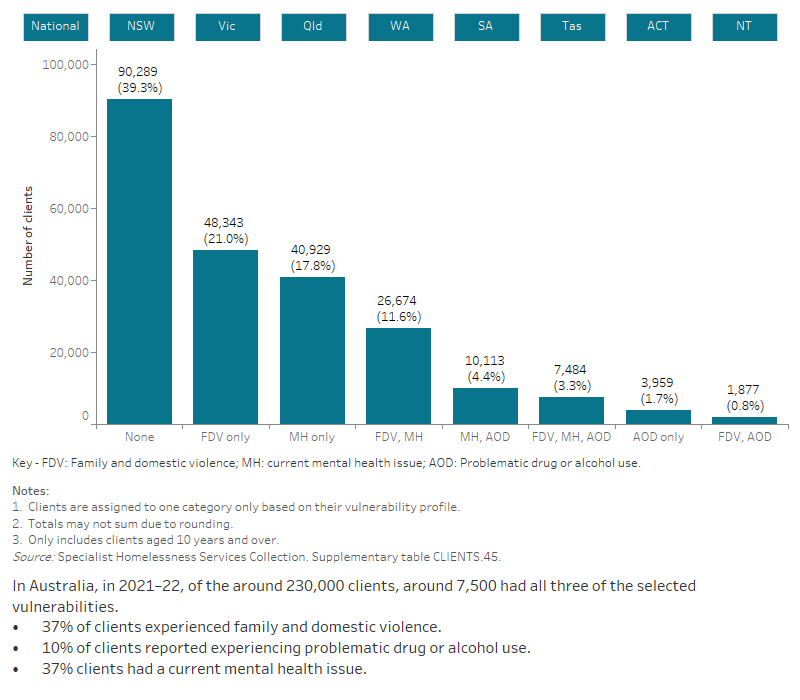
The interactive bar graph shows for each state and territory the number of SHS clients that experienced one or more of the additional selected vulnerabilities, including family and domestic violence, experiencing a current mental health issue and problematic drug and/or alcohol use. The graph shows both the number of clients experiencing a single vulnerability as well as combinations of vulnerabilities, and presents data for each state and territory.
National Disability Insurance Scheme (NDIS)
The National Disability Insurance Scheme (NDIS)
The National Disability Insurance Scheme (NDIS) supports people with a permanent and significant disability which affects their ability to take part in everyday activities. It is jointly governed and funded by the Australian and participating states and territory governments. The NDIS began its national rollout on 1 July 2016, and had been made available to all eligible Australians as of 1 July 2020 (NDIS 2020). Further details about the NDIS are provided in the Technical notes.
NDIS participation indicator
The NDIS participation indicator was introduced into the Specialist Homelessness Services Collection (SHSC) from 1 July 2019. A participant in the NDIS is an individual who reports they are receiving an agreed package of support through the National Disability Insurance Scheme. The NDIS question is asked of all clients at the start of a support period by SHS agency. Data are only available for clients who only had support period(s) starting from 1 July 2019 onwards.
In 2021–22, 4.9% (around 11,300) of SHS clients indicated that they were receiving a package of support through the NDIS, ranging from 2.5% of clients in the Northern Territory to 6.8% in Victoria. There was a high level of not stated responses for this measure: around 40,900 clients in 2021–22 (Supplementary table CLIENTS.17) which was an improvement on the previous reporting period.
Housing situation on first presentation
Among those clients whose housing status was known at the beginning of their first support period in 2021–22 (supplementary table CLIENTS.11 and CLIENTS.12):
- Most clients (56% or around 140,000 clients) were at risk of homelessness rather than homeless (44% or more than 110,200) (Figure CLIENTS.4).
- Around 1 in 3 clients (31% or 85,500) were living in private or other housing (renter, rent-free, or owner).
- The proportion of males (48%) who were experiencing homelessness was higher than for females (36%).
Figure CLIENTS.4: Clients by housing situation at the beginning of support, 2021–22
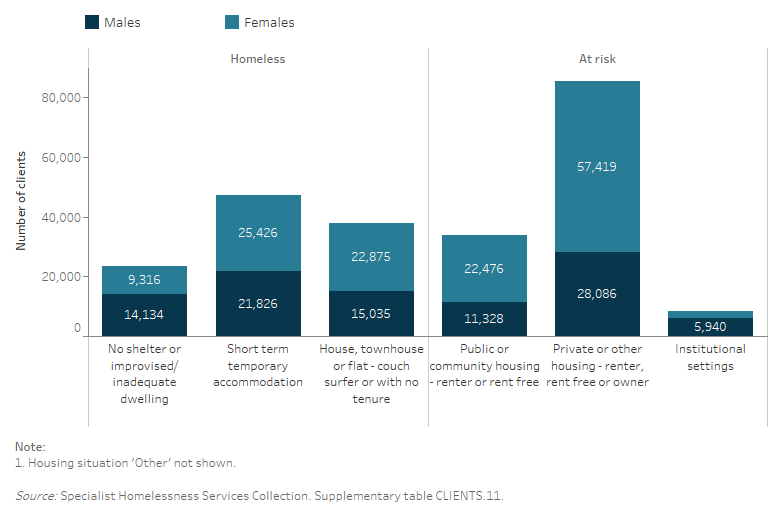
Of those clients with no shelter/improvised dwelling (more than 23,500 clients), 43% were sleeping in no dwelling, either on the street, in a park or out in the open and a further 23% were sleeping in a motor vehicle (Supplementary table CLIENTS.13).
Main source of income
Income support was high among SHS clients with 79% of clients aged 15 and over receiving some form of government payment (including awaiting a government payment) as their main source of income at the time they sought support in 2021–22 (Supplementary table CLIENTS.16).
The most common government payments were:
- JobSeeker (31% or 56,500 clients)
- Parenting Payment (17% or 31,200) and
- Disability Support Pension (15% or 27,200).
Around 1 in 10 (11%) of clients reported income from employment as their main source and 9.3% reported having no income.
Education
Of those whose educational status was known, over half of clients aged 5–24 (55% or over 44,200) were enrolled in some form of education in 2021–22 (Supplementary table CLIENTS.18). Almost 9 in 10 (88%) clients aged 5–14 were enrolled in school or other types of education, 12% of clients aged 5–14 (about 4,100) were not enrolled in education. Around two-thirds (69%) of clients aged 15–24 were not in some form of education (around 32,400 clients).
Labour force
Around 94,400 (52%) clients aged 15 or over were unemployed at the beginning of support in 2021–22 (Supplementary table CLIENTS.19). Males (57%) were more likely to be unemployed than females (49%). Almost 59,100 (33%) clients were not in the labour force.
More than 1 in 10 (15%) of SHS clients were employed and of these, 3 in 5 (60%) were employed on a part-time basis. Of the 153,500 clients who were unemployed or not in the labour force, around 12,400 (8.5%) were enrolled in some form of education (Supplementary table CLIENTS.20).
Clients service use in 2021–22
Support periods
Data collected by specialist homelessness agencies are based on support periods (see Technical notes for further information). Clients may have had more than one support period in 2021–22, either with the same agency at different times or with different agencies. In 2021–22:
- Clients assisted by homelessness agencies had almost 488,700 support periods. The number of support periods has increased by an average annual growth of 2.3% each year since 2011–12 (Historical table HIST.CLIENTS).
- Two-thirds of clients had only one support period (64%) while 1 in 5 (20%) had 2 support periods, 7.5% had 3 support periods and 8.4% had 4 or more (Supplementary table CLIENTS.27).
- The majority of support periods were opened and closed within 2021–22 (73% or around 355,600). An additional 13% of support periods opened during the year and remained open on 30 June 2022. A small proportion (3.0%) were ongoing throughout the 2021–22 reporting period (Figure CLIENTS.5).
Figure CLIENTS.5: Support periods, by indicative duration over the reporting period, 2021–22
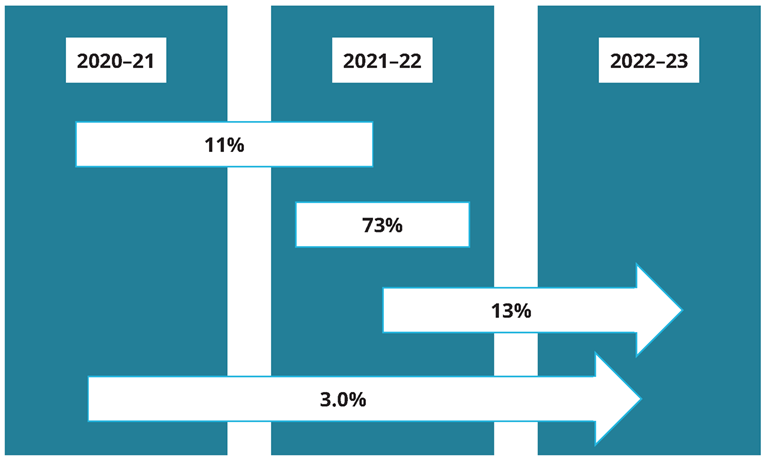
Source: Specialist Homelessness Services Collection 2021–22, Supplementary table CLIENTS.28.
Number of days clients received support
In 2021–22, 27.7 million support days were provided by SHS agencies to clients.
-
The median number of support days for clients was 53 days, similar for males (50 days) and females (56 days), while clients received an average of 1.8 support periods (Supplementary tables CLIENTS.29 and CLIENTS.46).
- The proportion of SHS clients receiving accommodation has been constant over time from 29% in 2017–18 to 30% in 2021–22 and the median number of nights accommodated has also remained at 32 nights in 2021–22, after falling to 28 nights in 2019–20 (Supplementary table CLIENTS.46).
- The needs of some clients can be met relatively quickly but clients with more complex needs received more support. Three in 10 clients (29% or nearly 78,700 clients) received between 6 and 45 days of support during 2021–22; 18% received support for up to 5 days, 17% received support for 91–180 days and 1 in 5 clients (20%) received over 180 days of support (Supplementary table CLIENTS.29).
Reasons that support ended
- More than half (57%) of support periods ended in 2021–22 because the client’s immediate needs were met or case management goals were achieved (Supplementary table CLIENTS.30).
- Almost one-quarter (22%) of support periods ended because the client no longer requested assistance; that is, a client may have decided that they no longer required assistance or they may have moved from the state/territory or region.
- A further 13% of support periods closed because the client was referred to another specialist homelessness agency and 14% closed because contact was lost with the client.
Clients’ needs for assistance and services provided
The SHSC includes information about clients’ needs for services from two perspectives:
- The client’s reasons for seeking assistance at the start of support – both the main reason for seeking support and all reasons for seeking support are collected.
- The agency worker’s assessment of the client’s needs – this information is captured when clients first present for assistance and each month while a client is still in contact with the agency.
Technical information and Glossary provide more information about how clients’ needs for assistance are captured in the SHSC.
Services provided to clients range from the direct provision of accommodation, such as a bed in a shelter, to more specialised services such as counselling and legal support. These services are generally either provided to the client directly by the agency or the client is referred to another service. Unmet need provides further information about clients’ needs that went unmet.
Reasons for seeking assistance
SHS clients can identify a number of reasons for seeking assistance, reflecting the range of situations that contribute to housing instability. SHS agencies also record the main reason for clients seeking assistance. In terms of the reasons why clients sought assistance in 2021–22 (Supplementary table CLIENTS.21):
- Accommodation issues (including housing crisis, inadequate or inappropriate dwelling conditions or that previous accommodation had ended) were nominated by 54% of clients (or around 146,800 clients).
- More than one-third (37% of clients) were experiencing housing crisis.
- A high proportion (39%) were experiencing financial difficulties, while almost 1 in 3 clients (31%) were affected by housing affordability stress.
- Interpersonal and relationship issues, including family and domestic violence, affected over half of all SHS clients (51% or about 136,600 clients). Within this group, 37% identified family and domestic violence.
The main reasons for seeking assistance in 2021–22 were similar to the reasons why clients more generally sought assistance from SHS agencies (Supplementary table CLIENTS.22, Figure CLIENTS.6):
- Family and domestic violence was the most common main reason identified for seeking assistance for more than one-quarter of clients (27% or more than 72,900 clients). For more information, see Clients experiencing family and domestic violence.
- One in 5 (20% or around 53,500) identified housing crisis as the main reason for seeking assistance.
Figure CLIENTS.6: Main reason for seeking assistance (top 6), by homelessness status, 2021–22
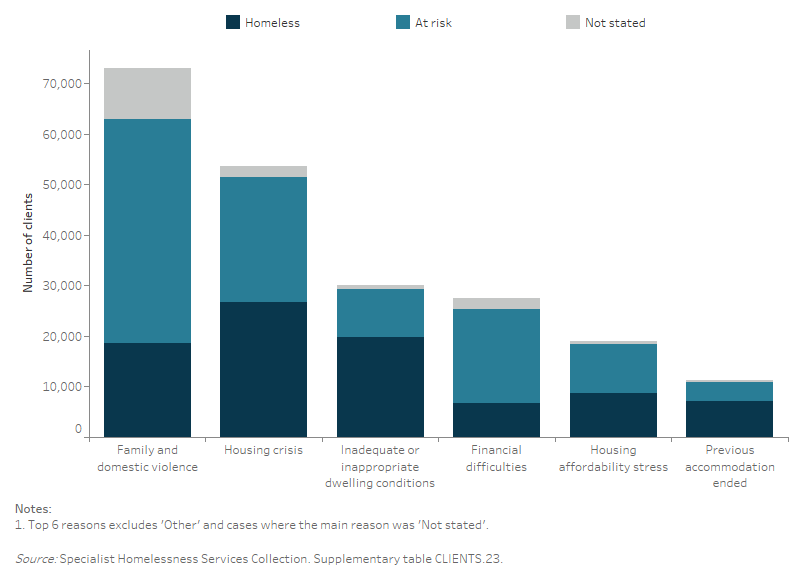
For those clients presenting at risk of homelessness, the most common main reasons for seeking assistance were (Supplementary table CLIENTS.23):
- family and domestic violence (32%)
- housing crisis (18%)
- financial difficulties (13%).
For those clients presenting as homeless, the most common main reasons for seeking assistance were:
- housing crisis (24%)
- inadequate or inappropriate dwelling conditions (18%)
- family and domestic violence (17%).
Housing and accommodation services
Housing and accommodation services provided by agencies include support to access:
- short-term or emergency accommodation
- medium-term/transitional housing
- long-term housing
- assistance to sustain tenancy or prevent tenancy failure or eviction
- assistance to prevent foreclosures or for mortgage arrears.
In 2021–22, 60% of SHS clients identified a need for accommodation services (Supplementary table CLIENTS.24). Of these 164,400 clients:
- 83,200 (51%) were provided with accommodation by the agency
- 25,500 (16%) were referred to another agency for accommodation provision
- 55,700 (34%) were neither provided nor referred for assistance. These clients are further described in Unmet need.
Assistance to sustain tenancy/prevent eviction was needed by 32% of clients at some stage during their support in 2021–22. This group includes those who were still housed when they approached a SHS agency and were supported to remain in that housing. It also includes those who identified a need for accommodation, were assisted to secure new housing and then supported to sustain that housing. Most clients (69,800 clients, or about 81% of those who needed it) received assistance to sustain tenancy directly from the specialist homelessness agency.
General support and assistance
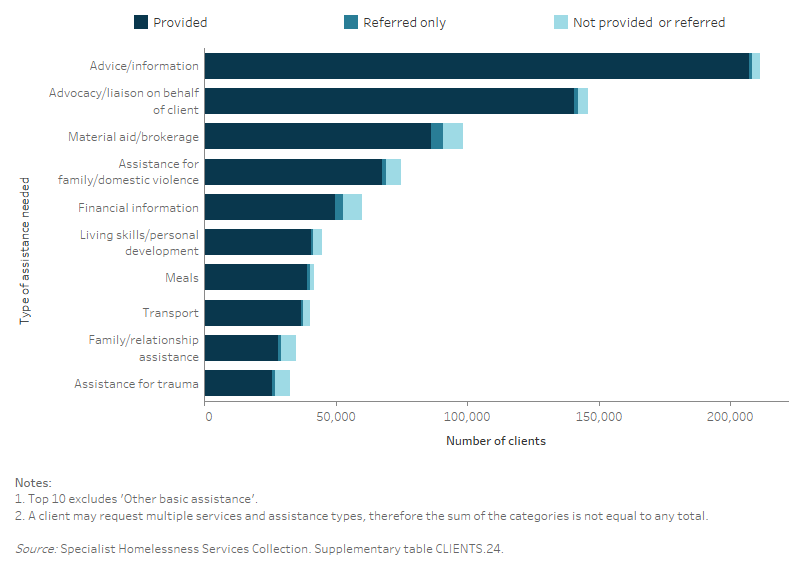
Some types of assistance provided by SHS agencies can be described as ‘general support and assistance’ compared with more specialised services. These services include advice and information, material aid, meals and living skills. In 2021–22:
- Clients most commonly needed advice and information (77% or around 211,300 clients). The next most common need was advocacy and liaison (54% or around 145,800) and material aid/brokerage (36% or more than 98,200) (Supplementary table CLIENTS.24, Figure CLIENTS.7).
- Services almost always provided the advice and information when needed. This differs from some specialised services, such as legal information and training or employment assistance, for which clients were more often referred to another agency (see Supplementary table CLIENTS.24).
Figure CLIENTS.7: Clients, by need for general services and service provision status (top 10), 2021–22
Specialised services
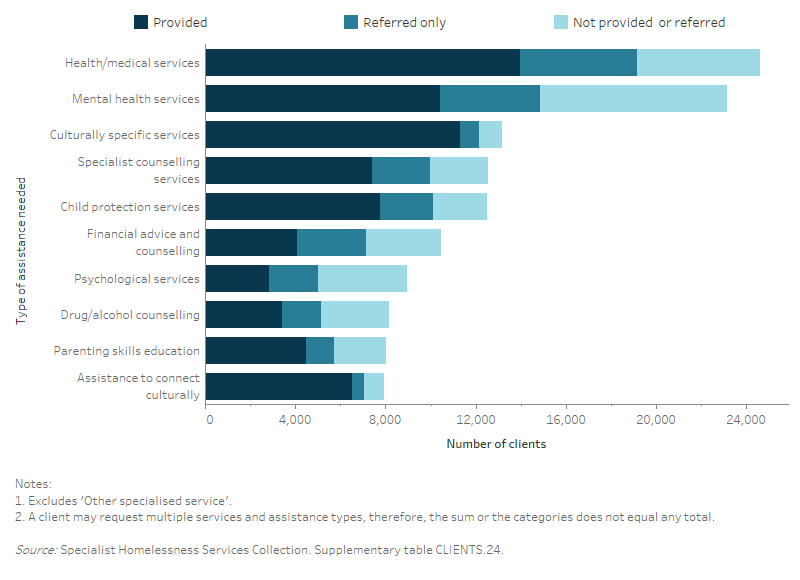
Specialised services refer to those services that require specific knowledge or skills and are usually undertaken by someone with qualifications to provide the particular service.
- Health/medical services were identified as needed by almost 1 in 10 clients (or over 24,600) in 2021–22 and were one of the specialised services most often referred (21%) (Figure CLIENTS.8).
- There has been little change in the most common specialised services needed and provided over the 5 years to 2021–22; for example, health/medical services, mental health services and specialist counselling were the most commonly needed services.
Figure CLIENTS.8: Clients by need for specialised services and service provision status (top 10), 2021–22
Financial assistance
In 2021–22, $104.1 million in financial assistance was provided to clients, a 4.9% decrease from the $109.4 million provided in 2020–21 (not adjusted for inflation). This represents an average of $1,513 provided per client requesting financial assistance, and a decrease from $1,592 in 2020–21 (not adjusted for inflation) (Supplementary tables CLIENTS.26 and CLIENTS.38). The reduction is likely related to emergency policies implemented during the COVID-19 pandemic ceasing prior to or during 2021–22.
- More than three-quarters (81%) of the financial assistance was used to assist clients with housing in 2021–22.
- Almost half of the financial assistance (49% or $50.9 million) was used to provide short-term or emergency accommodation.
- Around $33.2 million (32%) of the financial assistance was used to assist clients to establish or maintain their existing tenancy.
Outcomes at the end of support
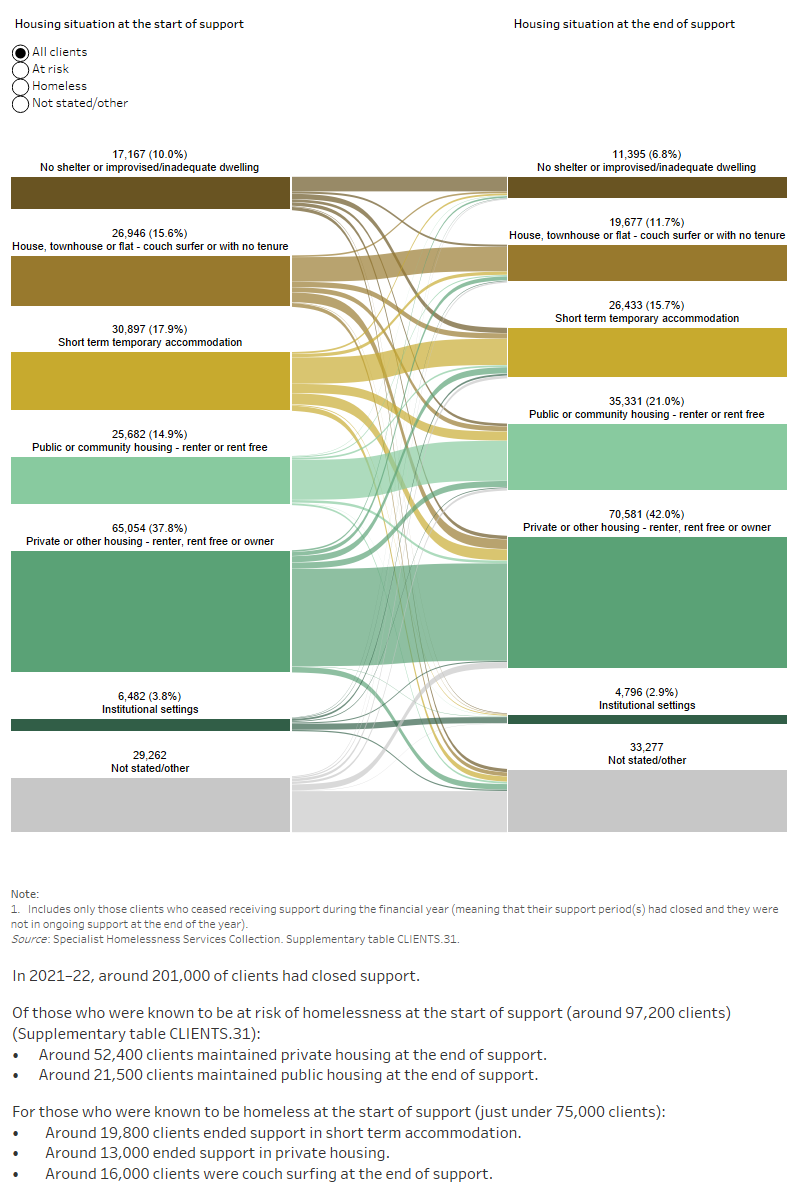
Outcomes presented here describe the change in clients’ housing situation between the start and end of support. Data is limited to clients who ceased receiving support during the financial year, meaning that their support periods had closed and they did not have ongoing support at the end of the year. Around 3 in 5 (163,600 clients or 59%) clients had support periods in 2021–22 that were both opened and closed and were non-ongoing at the end of the 2021–22 financial year.
Many clients had long periods of support or even multiple support periods during 2021–22. They may have had a number of changes in their housing situation over the course of their support. These changes within the year are not reflected in the data presented here, rather the client situation at the start of their first period of support during 2021–22 is compared with the end of their last period of support in 2021–22.
Three aspects of a client’s housing situation are considered in their housing circumstances: dwelling type, housing tenure and the conditions of occupancy. See Data presentation and derivation for details on how each of these categories are derived.
- The number of clients who were known to be homeless at the start of support reduced when support ended: 1 in 3 clients (34% or over 57,500) were known to be homeless when support ended, down from 44% (75,000) at the start of support (Supplementary table CLIENTS.31, Figure CLIENTS.9).
- The reduction in the proportion of clients who were homeless following support was due to decreases in the proportion of clients rough sleeping or with no shelter or living in improvised dwellings (from 10% to 6.8%) and in the proportion of clients living in a house, townhouse or flat as a ‘couch surfer’ with no tenure (from 16% to 12%).
- There was an increase in clients living in some form of tenure over the course of support, including an increase in the proportion of clients living in public or community housing from 15% (or 25,700 clients at the beginning of support) to 21% (or 35,300 clients at the end of support); and an increase in the proportion of clients living in private or other housing from 38% (or 65,100 clients at the beginning of support) to 42% (or 70,600 clients at the end of support).
These trends demonstrate that by the end of support, many clients have achieved or progressed towards a more positive housing solution. That is, clients ending support in public or community housing (renter or rent-free) or private or other housing (renter or rent-free) had increased compared with the start of support.
Figure CLIENTS.9: Housing situation at beginning and at end of support for clients with closed support, 2021–22
This interactive Sankey diagram shows the housing situation (including rough sleeping, couch surfing, short term accommodation, public/community housing, private housing and institutional settings) of clients with closed support periods at first presentation and at the end of support. The diagram shows clients’ housing situation journey from start to end of support. Most clients started and ended support in private or other housing.