Indigenous clients
Key findings: Indigenous SHS clients, 2021–22
A safe, secure home with working facilities is a key support for the good health and wellbeing of Aboriginal and Torres Strait Islander people. Historically, Indigenous Australians have been over-represented among people experiencing homelessness and among those seeking assistance with housing.
Aboriginal and Torres Strait Islander people make up around 3.2% of the Australian population (ABS 2022a) yet they made up around 20% (23,437 persons) of the estimated number of people experiencing homelessness on Census night in 2016 (ABS 2018) and over one-quarter or 28% of the clients (an estimated 72,900 clients) assisted by specialist homelessness services (SHS) in 2021–22. Not having affordable, secure and appropriate housing can further compound the social exclusion and disadvantage experienced by some Indigenous people (AIHW 2021).
Severe overcrowding as a form of homelessness is particularly prevalent in Indigenous families and communities. Indigenous Australians are more than 3 times as likely to live in overcrowded conditions than non-Indigenous Australians (AIHW 2021) and almost 3 times as likely to need one or more extra bedrooms compared with other households (ABS 2022b), even though the Census estimates may under-represent the extent of homelessness among Indigenous people.
Findings from the House of Representatives Standing Committee Inquiry into Homelessness (HRSC 2021) recommended a review of the data collection and estimation methods. The inquiry recommended greater inclusion of Indigenous Australian cultural practices and perspectives, particularly regarding the circumstances in which persons living in severely crowded dwellings and boarding houses should be categorised as homeless. The findings also highlight the effectiveness and appropriateness of Aboriginal community-controlled housing services, and recommended the development of a national integrated approach to housing and homelessness services for Indigenous Australians, co-designed with Indigenous community-controlled organisations and grounded in the principle of self-determination.
The 2020 National Agreement on Closing the Gap includes the socio-economic outcome that Aboriginal and Torres Strait Islander people can secure appropriate, affordable housing that is aligned with their priorities and need (COAG 2022). Under this outcome, by 2031, the proportion of Aboriginal and Torres Strait Islander people living in appropriately sized (not overcrowded) housing will increase to 88%. Key indicators to measure the progress made against the target include the homelessness rate, including by type (e.g. transitional housing/sleeping rough) and age group.
Under Closing the Gap, housing is one of five policy priority areas identified as requiring a joined up approached between the Commonwealth, states and territories and Aboriginal representatives, to identify opportunities to work more effectively across governments, reduce gaps and duplication, and improve outcomes. Housing is also one of four sectors that have been identified for joint national sector strengthening plans. The Housing Sector Strengthening Plan was approved by the Joint Council on Closing the Gap on 26 August 2022 and is in the initial phases of implementation.
Aboriginal and Torres Strait Islander people are a national priority cohort in the National Housing and Homelessness Agreement, which came into effect 1 July 2018 (CFFR 2018) (see Policy section for more information). This agreement provides a framework for all levels of government to work together to improve housing and homelessness outcomes for Indigenous Australians (AIHW 2019).
Over 314,100 Indigenous clients have been supported by homelessness agencies since the Specialist Homelessness Services Collection (SHSC) began in July 2011. The number of Indigenous clients has been steadily increasing over this time, most notably (Historical data table HIST.INDIGENOUS):
- Changes in the number of Indigenous clients over time may reflect improved Indigenous status data among people receiving SHS support. That is, there has been a substantial decrease in the proportion of SHS clients with ‘not stated’ Indigenous status over time, from 8.3% (35,600 clients) in 2011–12 to 3.4% (16,200 clients) in 2021–22.
- The rate of service use by Indigenous clients increased from 753.8 clients per 10,000 Indigenous people in 2017–18 to 798.7 in 2021–22.
- The ratio between the rate of Indigenous SHS clients compared with non-Indigenous clients has increased, from 8.8 in 2017–18 to 10.1 in 2021–22.
- The total number of Indigenous clients who received support from SHS agencies increased by an average rate of 5.3% annually over the 11 years to 2021–22, 3 times that of non-Indigenous clients (1.6% over the same period).
Client characteristics
Figure INDIGENOUS.1: Key demographics, Indigenous SHS clients, 2021–22
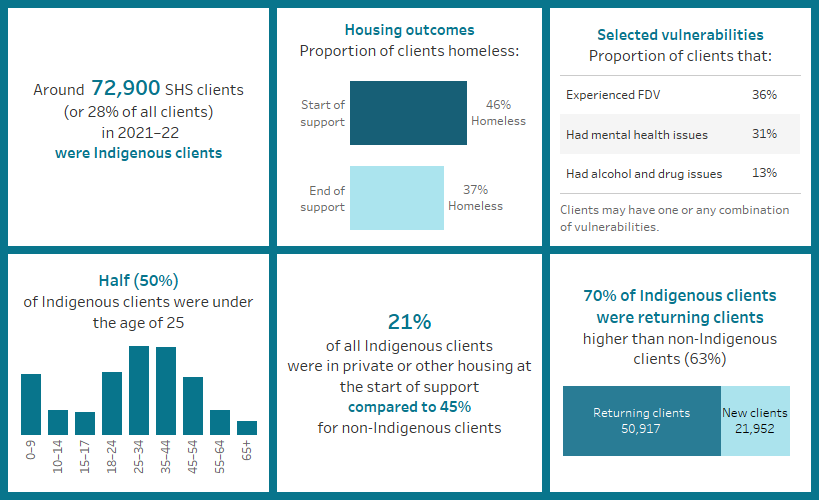
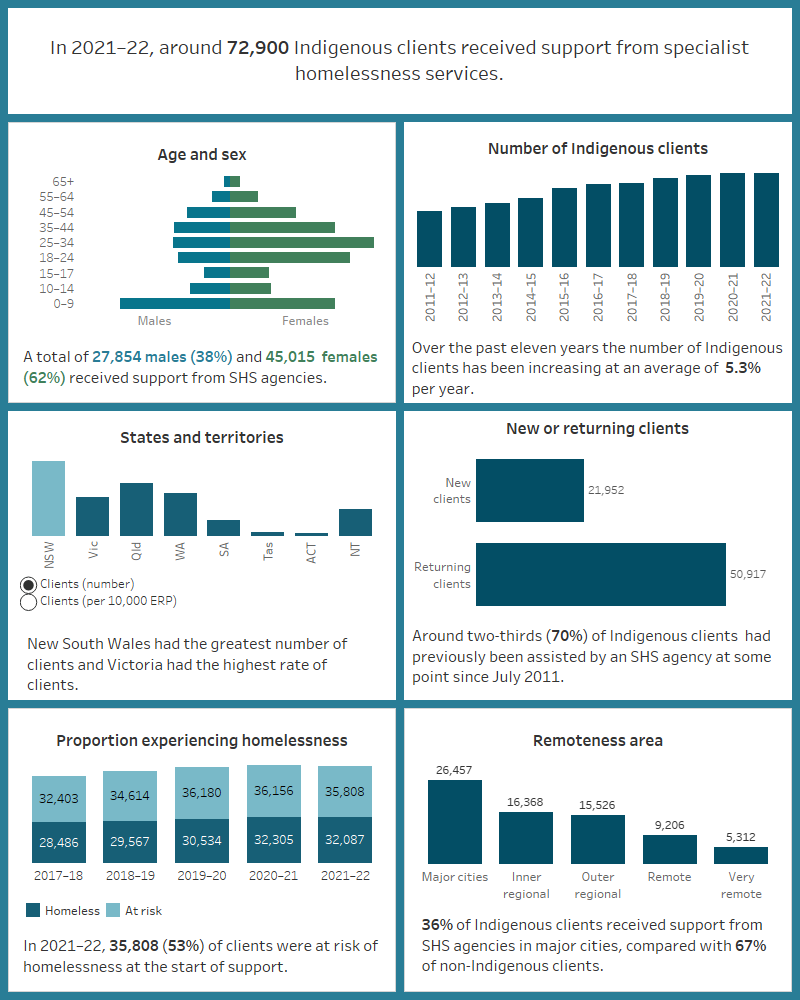
This interactive image describes the characteristics of around 72,900 Indigenous clients who received SHS support in 2021–22. Most clients were female, aged 18–34. The number of Indigenous clients has been increasing, while ‘not stated’ has decreased. New South Wales had the greatest number of Indigenous clients and Victoria had the highest rate of Indigenous clients per 10,000 population. The majority of clients had previously been assisted by a SHS agency since July 2011. More than half were at risk of homelessness at the start of support. Around a third of Indigenous clients received SHS support in major cities, while most non-Indigenous clients received support in major cities.
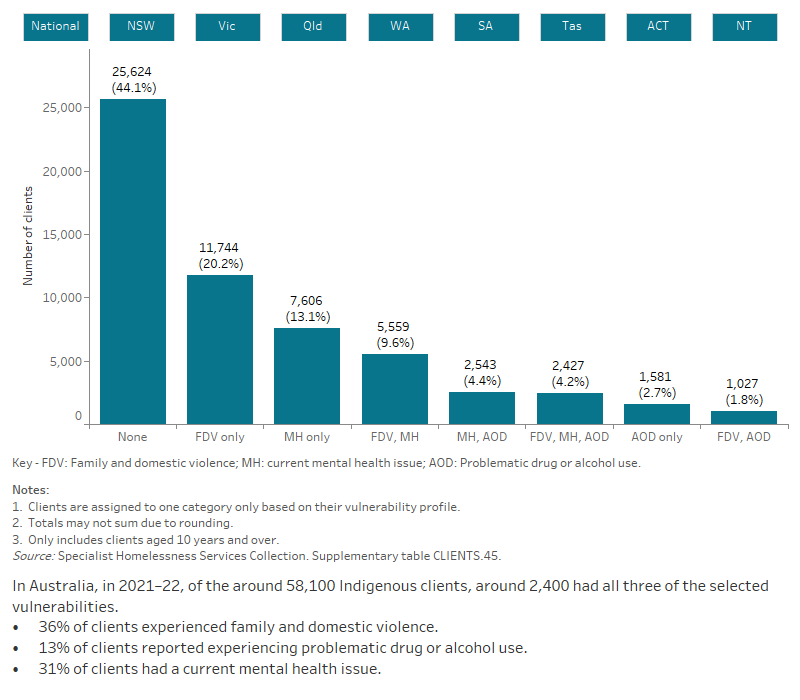
This interactive bar graph shows the number of Indigenous SHS clients also experiencing additional vulnerabilities, including family and domestic violence, having a current mental health issue and problematic drug and/or alcohol use. The graph shows both the number of clients experiencing a single vulnerability only, as well as combinations of vulnerabilities, and presents data for each state and territory.
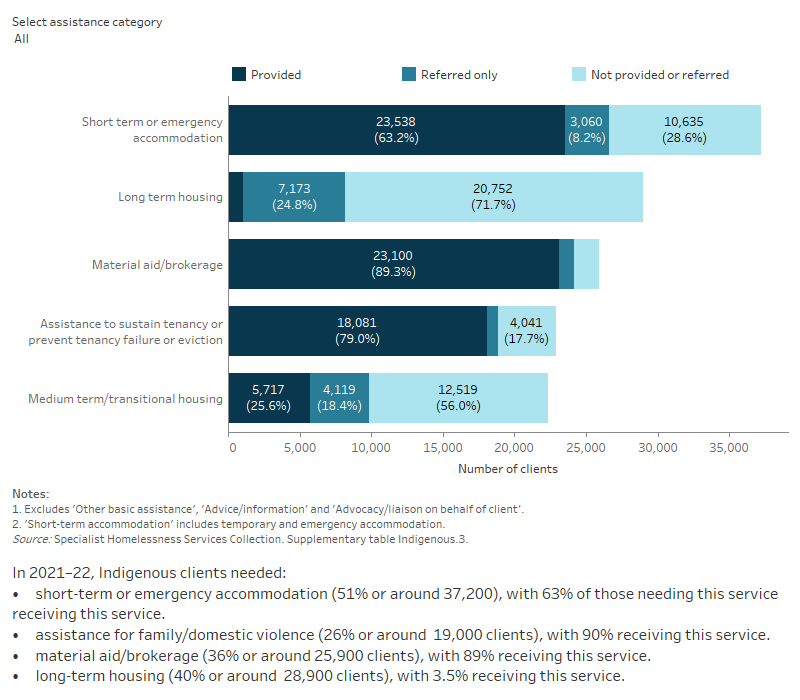
This interactive stacked horizontal bar graph shows the services needed by Indigenous clients and their provision status. Advice/information was the most needed and most provided service. Long term housing was the least provided service.
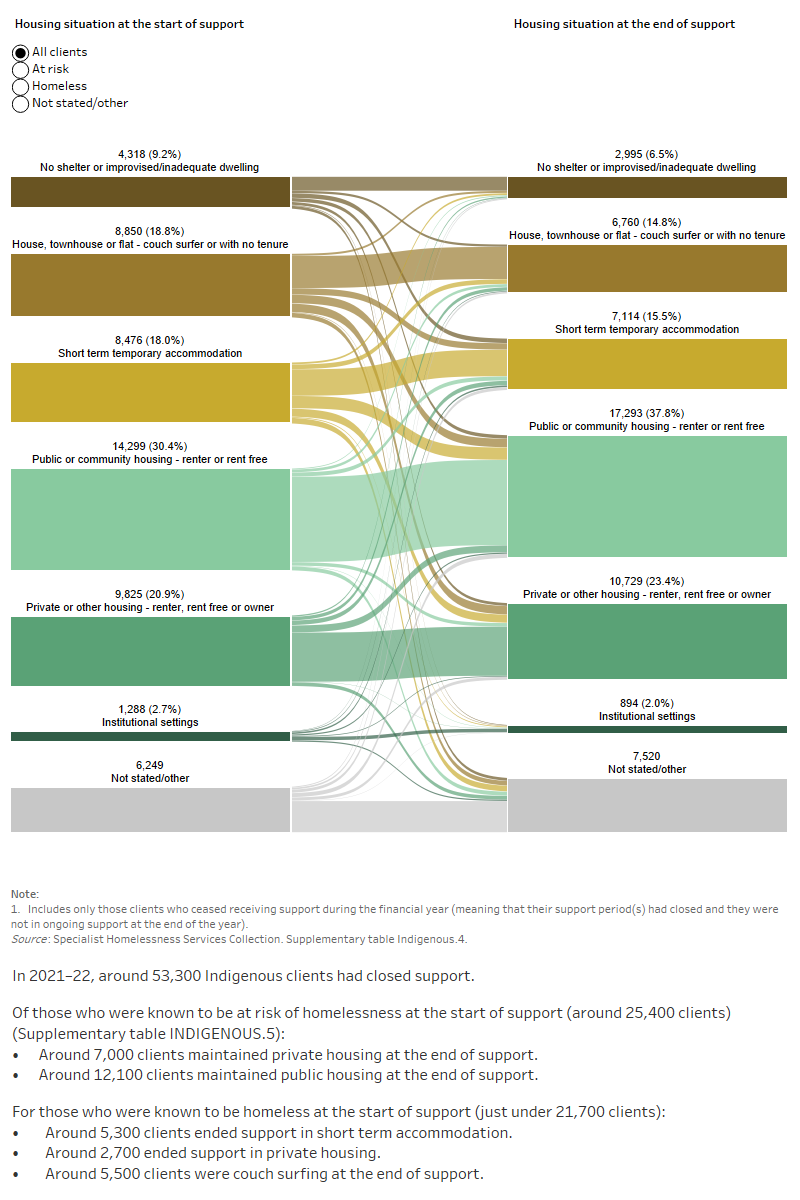
This interactive Sankey diagram shows the housing situation (including rough sleeping, couch surfing, short-term accommodation, public/community housing, private housing and institutional settings) of Indigenous clients with closed support periods at first presentation and at the end of support. The diagram shows clients’ housing situation journey from start to end of support. Most clients started and ended support in public housing.