Older clients

Key findings: Older clients, 2021–22

This image highlights a number of key findings concerning older clients. Around 25,300 SHS clients in 2021–22 were older clients; the rate of these clients was 9.9 per 10,000 population; the median length of support was 40 days; around 31%25 were experiencing mental health issues; and the most common main reasons for seeking assistance were housing crisis, financial difficulties and family and domestic violence.

Australia’s homeless population has aged rapidly. In 2006, about 12,500 people experiencing homelessness were aged 55 or older, increasing to about 14,600 in 2011 and about 18,700 in 2016 (ABS 2018a). The trend highlights the growing homelessness problem over time among Australia’s ageing population.

The lack of affordable housing in recent times has left many Australians at risk of homelessness. Older Australians have increasingly experienced rental stress, amid the increasing costs of housing and renting across Australia, with around one per cent of rental listings in Australia being considered affordable (rent costs less than 30% of their income) for a single person and couple on the age pension (Anglicare Australia 2022; AIHW 2022). Although Commonwealth Rent Assistance assist many older people with the costs of renting, more than 2 in 5 older people receiving this payment were considered to be in rental stress. Without affordable housing, many more older Australians may be at risk of or experience homelessness.

For some older people experiencing homelessness, homelessness has been an on and off – or ongoing – feature of their lives. With some entering homelessness again in later life, and others ageing into later life while homeless (Peteresen et al. 2014). For these older people, negative experiences (such as mental health issues, addiction, and prison time) and lifelong struggles were often common to their pathways into homelessness (Petersen et al. 2014).

Yet for other older people, this was not the case. Instead, their lives were fairly ‘conventional’, with many raising families and working (typically low paid) for most of their lives (Petersen et al. 2014). Among these older people (often older women), a major setback – such as the breakdown of a marriage, loss of a job, the death of a partner or the development of an illness – and a lack of savings led them toward their very first experience of homelessness (Canham et al. 2021; Kushel 2020).

Although homelessness is traumatising for all who experience it, experiencing homelessness in later life poses additional health risks and challenges (Scutella et al. 2014). Health problems are far more common among older people experiencing homelessness (Om et al. 2022; Nilsson et al. 2018). The harsh living conditions and reduced access to healthcare that often comes with homelessness can trigger, magnify or worsen health problems (Parsell et al. 2018). Older people experiencing homelessness are not only more likely to live with more disabilities, chronic diseases, complex health problems and geriatric symptoms but also die earlier (Canham et al. 2020; Humphries and Canham 2021; Nilsson et al. 2018).

Older SHS clients are defined as clients aged 55 years and over. For further information, see Technical notes.

Older women

The experience of homelessness has become increasingly widespread among older women, growing by over 30% between 2011 and 2016 to about 6,900 older women (ABS 2012, ABS 2018). While the shortage of affordable housing and the ageing population has contributed to the rising number of older people experiencing homelessness generally, lower lifetime earnings and savings is especially relevant to many older women’s experiences of homelessness. Given women are more likely to take leave from the workforce and return to paid employment on a part-time or casual basis, the amount of wealth accumulated is generally lower compared to men (Cameron 2013; Power et al. 2018).

Client characteristics

Figure OLDER.1: Key demographics, older SHS clients, 2021–22

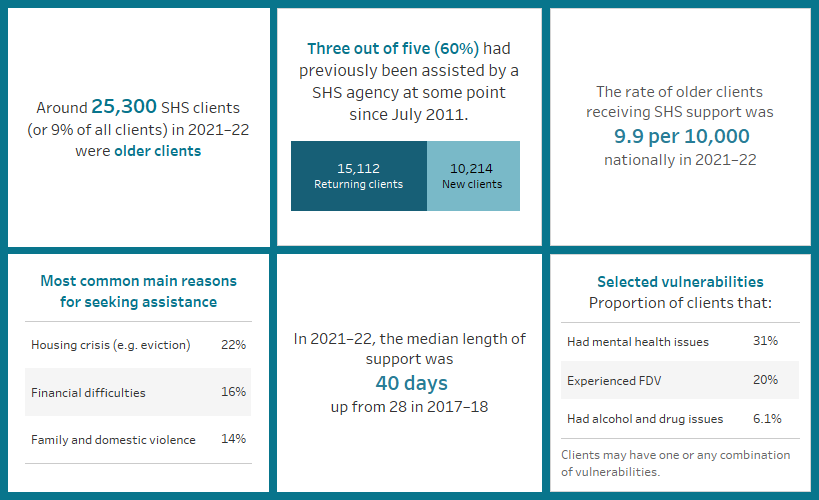
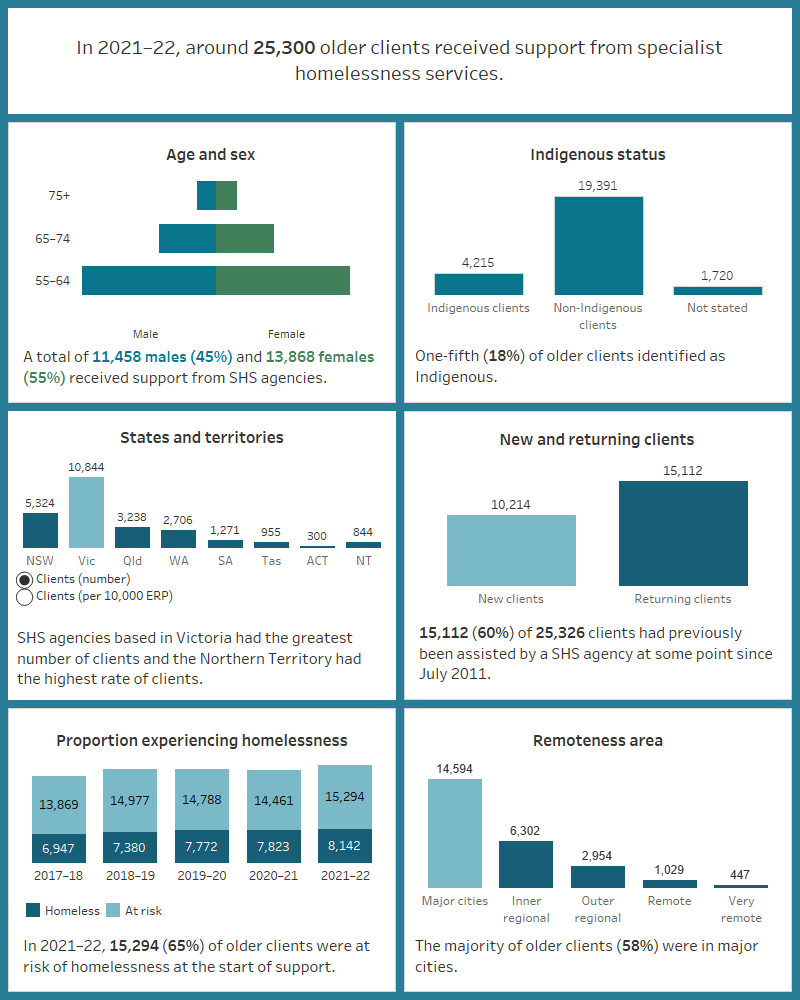
This interactive image describes the characteristics of around 25,300 older clients who received SHS support in 2021–22. Most were female, aged 55–64. Around one fifth were Indigenous. Victoria had the greatest number of clients and the Northern Territory had the highest rate of clients per 10,000 population. The majority of clients had previously been assisted by a SHS agency since July 2011. Most were at risk of homelessness at the start of support. Most were in major cities.

The number of clients aged 55 and over has risen by over 11,000 clients in the decade to 2021–22, from 14,300 clients in 2011–12 to 25,300 clients in 2021–22.

In 2021–22 (Historical table HIST.OLDER):

  • Older clients accounted for around 1 in 10 (9.3%) of all SHS clients. The proportion of older clients has been growing slowly since the collection began in 2011.
  • The rate of older clients has increased from 6.4 clients for every 10,000 people in 2011–12 to 9.9 in 2021–22.

Labour force

Almost all older clients (93%) were not working in a paid job in 2021–22 (Supplementary table OLDER.7). There were more clients not in the labour force (51%) than unemployed (41%).

Living arrangements

In 2021–22, of the almost 25,300 older clients with known living arrangement upon presentation to a SHS agency (Supplementary table CLIENTS.43):

  • Most (14,300 clients) were living alone; higher for males (71% of older male clients) than females (54%).
  • Around 1 in 10 (12% or 2,900 clients) were living with other family.

Selected vulnerabilities

The majority of older clients (54% or 13,700) did not have additional vulnerabilities that may contribute to the risk of experiencing homelessness, such as a current mental health issue, experiencing family and domestic violence, or problematic drug and/or alcohol use (Figure OLDER.2, Supplementary table CLIENTS.45).

Figure OLDER.2: Older clients, by selected vulnerability characteristics, 2021–22

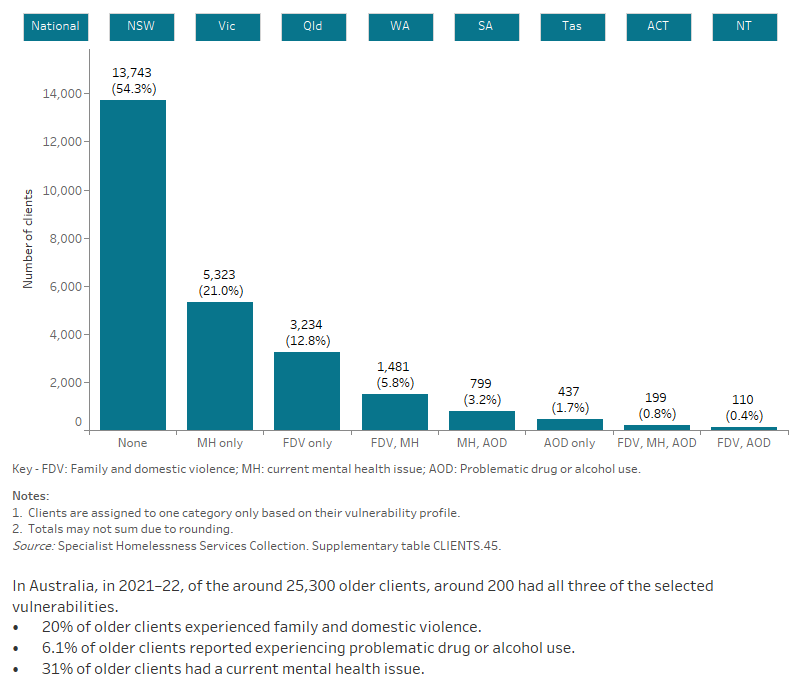
This interactive bar graph shows the number of older clients also experiencing additional vulnerabilities, including family and domestic violence, having a current mental health issue and problematic drug and/or alcohol use. The graph shows both the number of clients who experiencing a single vulnerability only, as well as combinations of vulnerabilities, and presents data for each state and territory.

Service use patterns

The length of support older clients received increased in 2021–22 to a median of 40 days, up from 28 days in 2017–18. The average number of support periods per client, however, was stable at 1.6 support periods per client over time.

The proportion of clients receiving accommodation increased from 16% of older clients in 2017–18 to 19% in 2021–22, while the median number of nights accommodated decreased slightly to 28 nights (Supplementary table CLIENTS.46).

New or returning clients

Around 60% (or 15,100 clients) of older SHS clients were returning clients – having been assisted by a SHS agency before (since the collection began in July 2011) – one of the lowest proportions among any SHS client group (Supplementary table CLIENTS.40). Most returning clients (68%) were aged 55–64. Of new clients, 57% were aged 55–64.

Main reasons for seeking assistance

The top 3 main reasons older clients sought assistance from SHS agencies in 2021–22 were (Supplementary table OLDER.5):

  • housing crisis (22% or 5,400 clients)
  • financial difficulties (16% or 3,900)
  • family and domestic violence (14% or 3,600).

The main reason older clients sought assistance was different for those experiencing homelessness compared with those presenting to services at risk of homelessness (Supplementary table OLDER.6).

  • For those experiencing homelessness the main reasons for seeking assistance were:
    • housing crisis (25% or over 2,000 clients)
    • inadequate or inappropriate dwelling conditions (24% or 1,900)
    • housing affordability stress (9.4% or 770).
  • For those at risk of homelessness:
    • housing crisis (22% or 3,400 clients)
    • financial difficulties (17% or 2,600)
    • family and domestic violence (16% or 2,400).

Services needed and provided

In 2021–22, over half (51% or 13,000) of older SHS clients needed accommodation; 37% of these clients were provided with some type of accommodation assistance and 22% were referred to another agency for this type of support. Demand was highest for long-term accommodation (39% or 9,900 needed long-term accommodation), though only 8.1% of older clients who needed it received it. By contrast, of the quarter (27%) of older clients who needed short-term accommodation, more than half (51%) received it (Figure OLDER.3, Supplementary table OLDER.2).

Other services most commonly needed by older clients during 2021–22 were:

  • assistance to sustain tenancy or prevent tenancy failure or eviction (33%), with 82% provided this assistance
  • material aid/brokerage (32%), with 88% provided this assistance
  • financial information (18%), with 83% provided with assistance.

Figure OLDER.3: Older clients, by services needed and provided, 2021–22

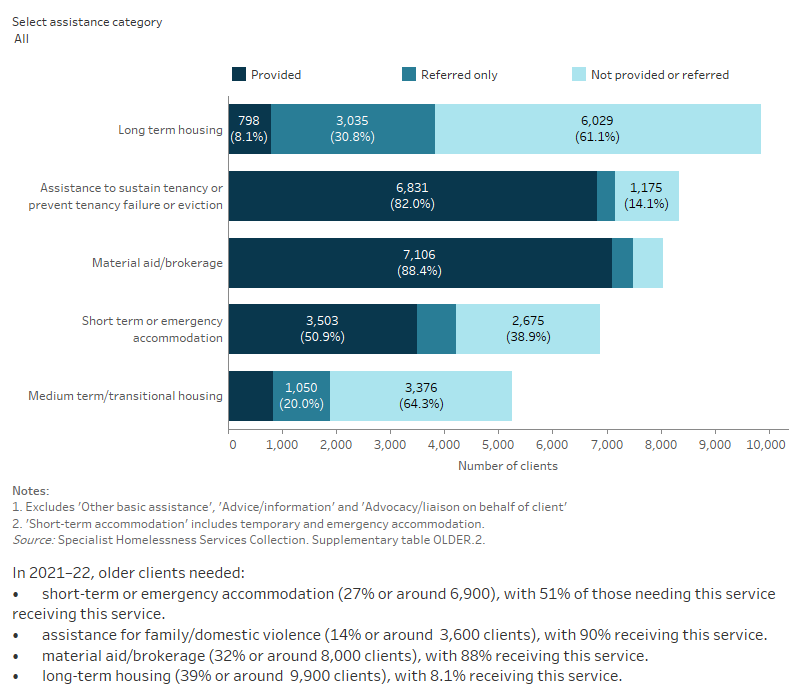
This interactive stacked horizontal bar graph shows the services needed by older clients and their provision status. Advice/information was the most needed and most provided service. Long term housing was the least provided service.

Housing situation and outcomes

Outcomes presented here highlight the changes in clients’ housing situation at the start and end of support. That is, the place they were residing before and after they were supported by a SHS agency. The information presented is limited only to the clients who have stopped receiving support during the financial year, and who are no longer receiving ongoing support from a SHS agency. In particular, information on client housing situations at the start of their first period of support during 2021–22 is compared with the end of their last period of support in 2021–22. As such, this information does not cover any changes to their housing situation during their support period.

More than one-third (34% or 5,700 clients) of older clients were experiencing homelessness at the start of support; 2,100 (13%) were in short-term temporary accommodation and 1,900 (12%) had no shelter or were in an improvised/inadequate dwelling (Supplementary table OLDER.3).

By the end of support, fewer older clients were known to be experiencing homelessness (27%). Instead, most older clients (73%) were living in stable accommodation by the end of support in 2021–22, be it public or community housing, private or other housing or an institutional setting (Supplementary table OLDER.4).

Figure OLDER.4: Housing situation for older clients with closed support, 2021–22

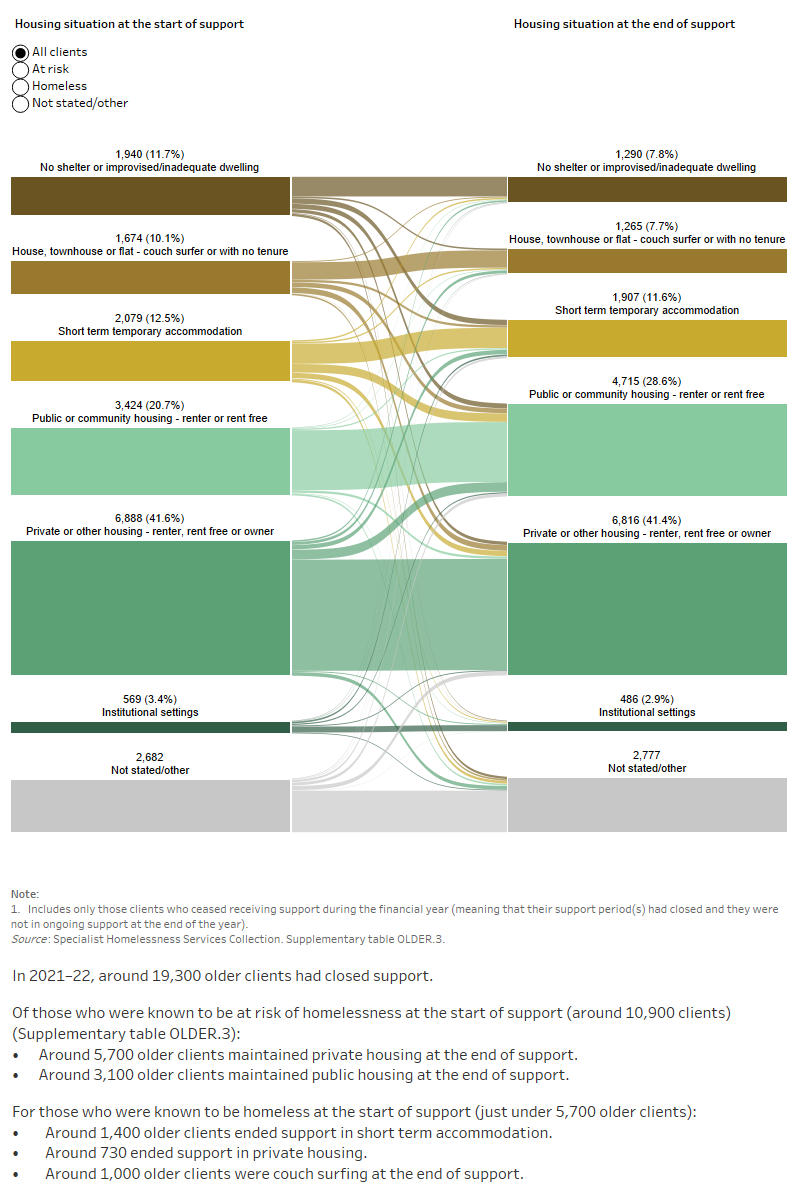
This interactive Sankey diagram shows the housing situation (including rough sleeping, couch surfing, short term accommodation, public/community housing, private housing and Institutional settings) of older clients with closed support periods at first presentation and at the end of support. The diagram shows clients’ housing situation journey from start to end of support. Most clients started and ended support in private housing.