Service geography
Key findings: Clients of SHS agencies, by remoteness area, 2021–22
Access to services can become increasingly difficult the further away a client is from a major city (ABS 2018). For Specialist Homelessness Services (SHS), state and territory systems for the assessment, intake, referral and ongoing case management of SHS clients vary, ranging from agency-based to centralised management models (PC 2022).
Reporting service location in the Specialist Homelessness Services Collection (SHSC)
This section examines client service needs and characteristics based on the location of the SHS agency, where the service was received, that is, the profile of clients receiving support as provided by services in specific areas. Clients can access services in more than one remoteness area, however, for the purpose of the analysis, clients are assigned to one remoteness area based on the SHS agency where they first sought support during 2021–22. The 2016 Australian Statistical Geography Standard (ASGS) (ABS 2018) is used to classify agencies by remoteness area based on the location details of each agency (see Technical information).
State-wide SHS operate in some states/territories and can assist a high number of clients over the phone. Therefore, service location data may not be accurate or relevant for some clients.
In interpreting regional service trends throughout this section, ‘urban areas’ refer to Major cities and Inner and Outer regional areas and ‘remote areas’ refer to Remote and Very remote areas, unless otherwise stated.
In 2021–22, clients receiving assistance from SHS agencies in urban and remote areas had different characteristics:
-
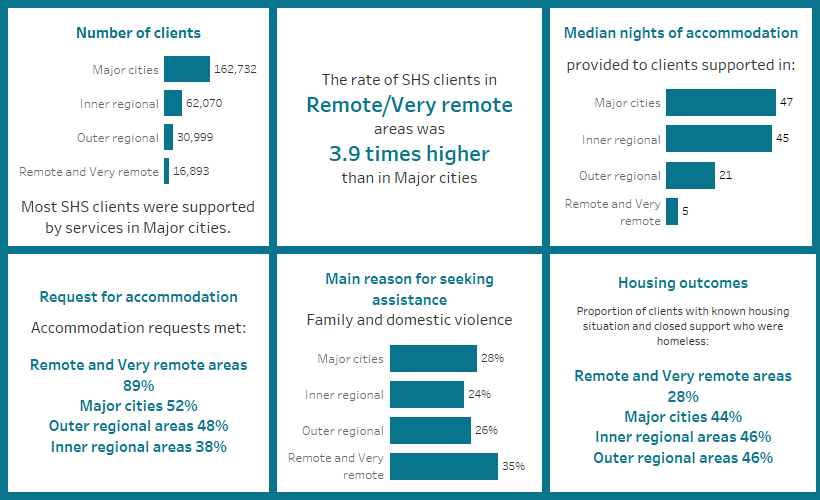
The proportion of clients (with known housing situation) who were experiencing homelessness at first presentation was lower among the clients receiving support from services in Remote and very remote areas (28%) compared with Major cities (44%) (Supplementary table REG.5).
- The median length of accommodation received by clients of services in Major cities was 47 nights, compared with 5 nights in Remote and very remote areas (Supplementary table REG.7).
- More than 9 in 10 clients (92%) receiving services in remote areas identified as Aboriginal or Torres Strait Islander (Supplementary table INDIGENOUS.6)
- Almost 1 in 5 clients (19%) in Remote and very remote areas were 0–9 years of age (Supplementary table REG.2).
- Almost 9 in 10 (86%) SHS clients born overseas received support from SHS agencies located in Major cities (Supplementary table CLIENTS.6).
- Of clients with a current mental health issue (around 85,200 clients), almost 2 in 3 (64%) received support from SHS agencies in Major cities and over 1 in 4 (26%) in Inner regional areas (Supplementary table CLIENTS.44).
- Clients who have experienced family and domestic violence (around 107,700 clients) mainly received support from SHS agencies in Major cities (62%) and around 1 in 5 (21%) in Inner regional areas (Supplementary table CLIENTS.44).
- The most common main reasons clients sought assistance in the various remoteness areas (Supplementary table REG.1) were:
- Major cities: family and domestic violence (28%), followed by housing crisis (20%)
- Inner and Outer regional areas: family and domestic violence (24% and 26% respectively) and housing crisis (23% and 21% respectively)
- Remote and very remote areas: family and domestic violence (35%) and inadequate or inappropriate dwelling conditions (8.2%).
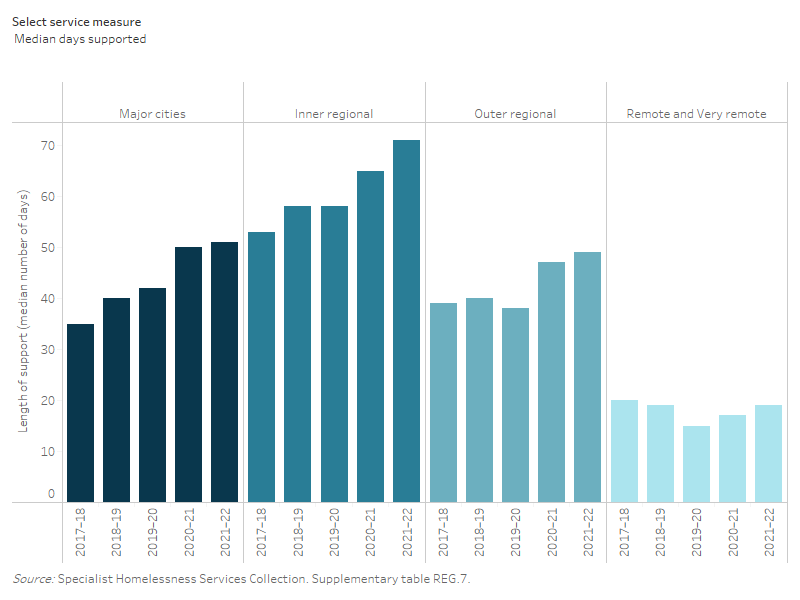
Figure REG.1: Service use patterns for SHS clients by remoteness area, 2017–18 to 2021–22
This interactive bar graph shows service use patterns by remoteness areas between 2017–18 and 2021–22. The graph presents data for the median number of days clients received support from SHS agencies, the average number of support periods per client, the median number of nights accommodated, and the proportion of clients receiving accommodation. Across all five years, clients in inner regional areas had the highest median number of support days, and clients in remote and very remote areas had the lowest median number of support days.
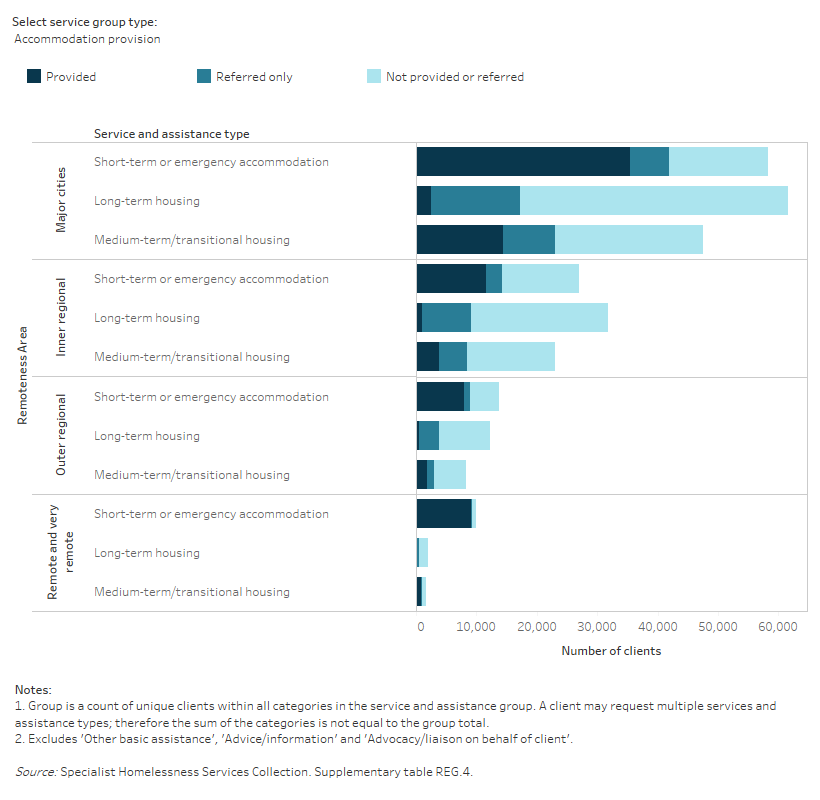
This interactive horizontal bar graph shows services needed by provision status and by remoteness area. Long term housing was the most needed accommodation provision service in major cities and the least provided. Short term or emergency accommodation was the most commonly provided accommodation service across remoteness areas.
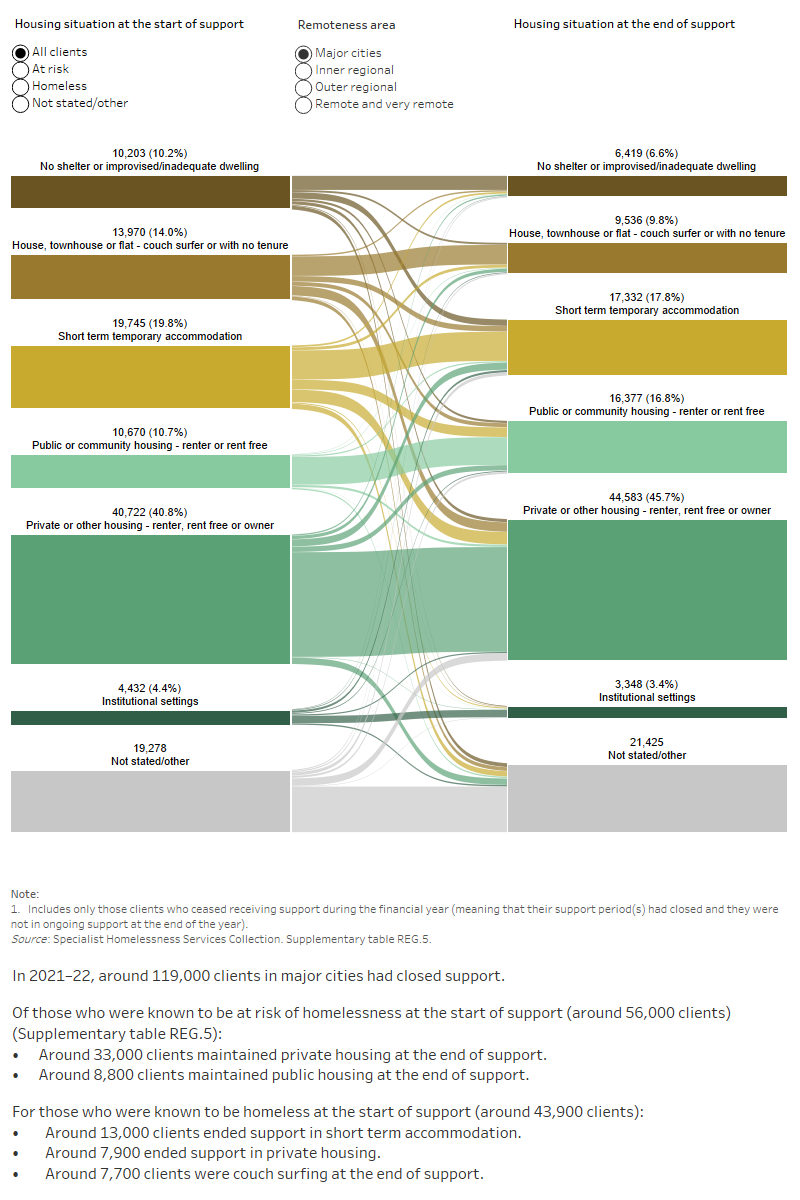
This interactive Sankey diagram shows the housing situation (including rough sleeping, couch surfing, short term accommodation, public/community housing, private housing and institutional settings) of clients with closed support periods at first presentation and at the end of support, by remoteness area. The diagram shows clients’ housing situation journey from start to end of support. Most clients started and ended support in private or other housing.