Clients with disability

Key findings: Clients with disability, 2021–22

This image highlights a number of key finding concerning clients with severe or profound disability. Around 7,300 SHS clients in 2021–22 were clients with disability; the most common reasons for seeking assistance were housing crisis, family and domestic violence and inadequate/inappropriate dwelling; around 62%25 were experiencing mental health issues; 43%25 started support homeless and 32%25 ended support homeless; 2 in 5 presented to SHS agencies alone; and two thirds had previously been assisted at some point since July 2011.

Disability is widespread across the Australian population, with 1 in 6 Australians having some form of disability (ABS 2019). As such, people with disability are a diverse group encompassing people across all socioeconomic and demographic groups (AIHW 2020). A disability is any limitation, restriction or impairment restricting everyday activities, be it physical, intellectual, sensory or psychosocial (ABS 2019). About 5% of Australia’s homeless population are people with a profound or severe disability (ABS 2018).

The pathways into homelessness for people with disability are diverse and can be influenced by their location, disability type and level of disability (Beer et al. 2019). People with disability may have a greater risk of experiencing homelessness than others, as they typically earn lower incomes, engage less with labour markets and face more discrimination in private rental markets than others (Beer et al. 2012; Groot et al. 2020; Major et al 2018).

Reporting clients with disability in the Specialist Homelessness Services Collection (SHSC)

Disability is a challenging concept to measure and there are numerous definitions. The SHSC disability questions aim to establish whether a client has any difficulty and/or need for assistance with 3 core activities (self-care, mobility and communication). These questions are asked of all Specialist homelessness services (SHS) clients.

For the purposes of this report, people who identified that they have a limitation in core activities (and who also reported that they always or sometimes needed assistance with one or more of these core activities) are described as living with a disability. The term ‘severe or profound core activity limitation’ is used to refer to this subgroup of people living with disability in the report.

Data for clients with disability who required assistance may not be comparable across age groups due to differences in the interpretation of the SHSC disability questions. This issue mainly relates to young children, and therefore any comparisons between age groups should be made with caution.

Further details about measuring disability in the SHSC and the definition of a client with severe or profound core activity limitation are provided in the Technical notes.

Client characteristics

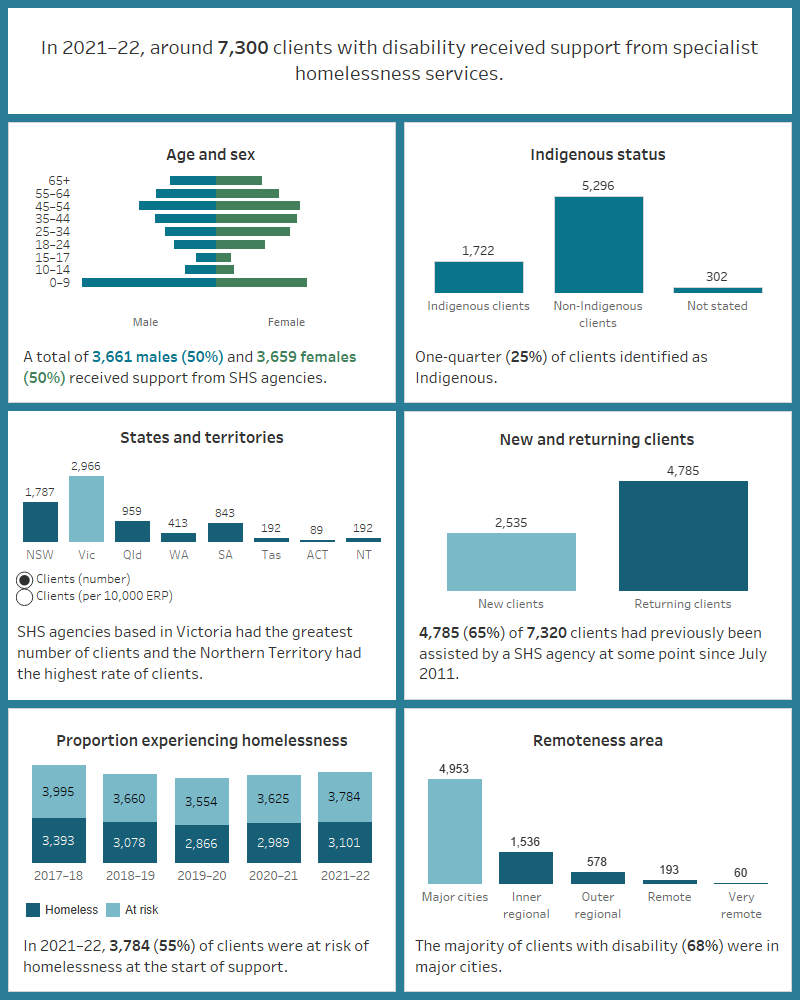
Figure DIS.1: Key demographics, SHS clients with disability, 2021–22

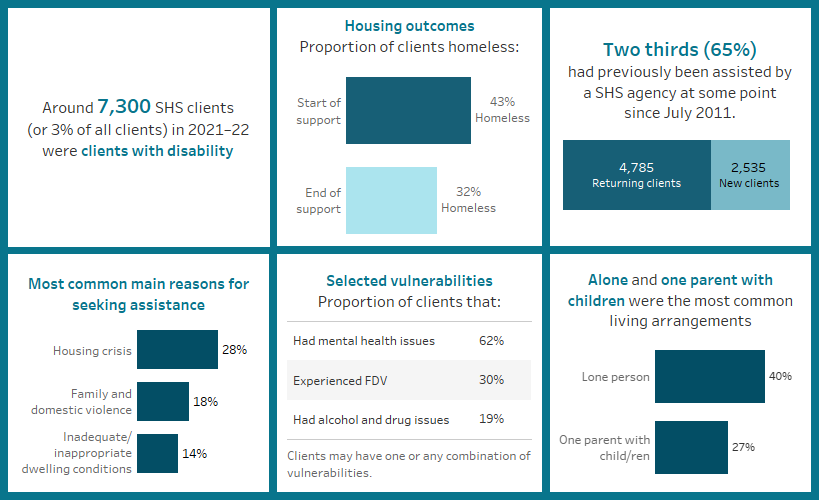
This interactive image describes the characteristics of around 7,300 clients with disability who received SHS support in 2021–22. Most clients were aged 0–9. A quarter were Indigenous. Victoria had the greatest number of clients and the Northern Territory had the highest rate of clients per 10,000 population. The majority of clients had previously been assisted by a SHS agency since July 2011. Most started support at risk of homelessness. Most were in major cities. 

Changes over time

The number of clients with disability has varied over time, growing from around 7,000 clients (2.7% of all SHS clients) in 2013–14 to a of peak of almost 11,000 clients (3.8%) by 2016–17. Between 2014–15 and 2019–20 the number declined to around 6,700 clients. For the most recent two financial years, the number of clients with disability has increased again, to 7,000 in 2020–21and 7,300 clients in 2021–22 (Supplementary table HIST.DIS).

Presenting unit type and Living arrangements

Of the 7,300 clients living with disability, most clients sought assistance from a SHS agency alone (65% or 4,800 clients) or with child/ren (25% or 1,800 clients) (Supplementary table CLIENTS.42). At the start of support, clients were most commonly living alone (40% or 2,900 clients) or as a single parent with child/ren (27% or 1,900) (Supplementary table CLIENTS.43).

Selected vulnerabilities

Clients with disability may face other vulnerabilities, alongside their disability. In 2021–22, almost 3 in 4 (72% or around 4,100) clients living with disability experienced one or more other vulnerabilities, including a current mental health issue, problematic drug and/or alcohol use or family and domestic violence (Supplementary table CLIENTS.45) (Figure DIS.2).

Figure DIS.2: Clients with disability, by selected vulnerability characteristics, 2021–22

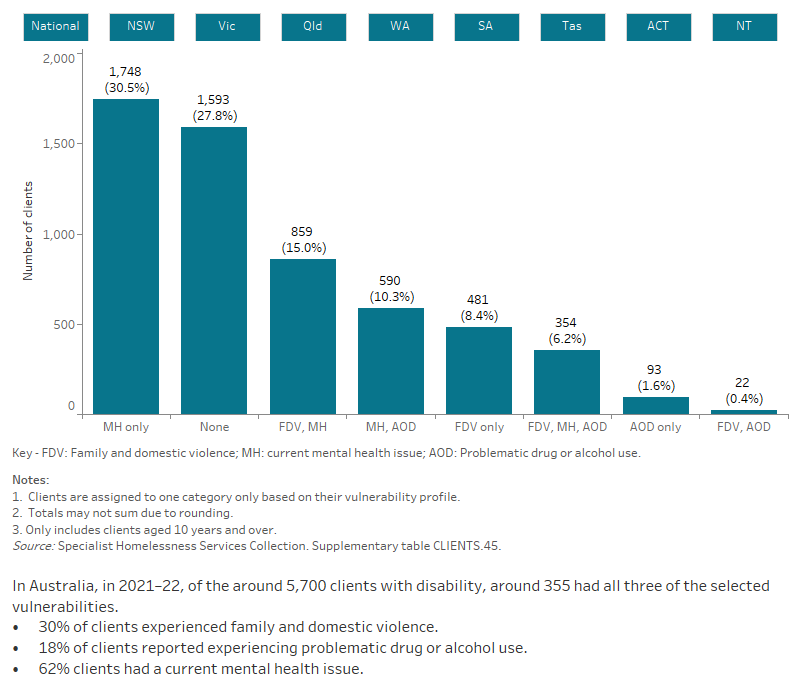
The interactive bar graph shows the number of clients with severe or profound disability also experiencing additional vulnerabilities, including having a current mental health issue and problematic drug and/or alcohol use. The graph shows both the number of clients who experiencing a single vulnerability only, as well as combinations of vulnerabilities, and presents data for each state and territory.

The National Disability Insurance Scheme (NDIS)

The National Disability Insurance Scheme (NDIS) supports people with a permanent and significant disability which affects their ability to take part in everyday activities. It is jointly governed and funded by the Australian and participating states and territory governments. Further details about the NDIS are provided in the Technical notes.

NDIS participation indicator

The NDIS participation indicator was introduced into the Specialist Homelessness Services Collection (SHSC) from 1 July 2019. A participant in the NDIS is an individual who is receiving an agreed package of support through the National Disability Insurance Scheme. The NDIS question is asked of all clients at the start of support from a SHS agency. Data are not available for clients who only had support period(s) starting before 1 July 2019.

National Disability Insurance Scheme (NDIS) participants

A person can be identified as being a SHS client with severe or profound disability but not be a participant in the NDIS. This may be because the client did not meet the NDIS eligibility criteria, has not applied for the NDIS or has a pending application. These clients may still be receiving disability support under other programs provided by Australian and state/territory governments. In 2021–22, almost 11,300 clients were NDIS participants (Supplementary table CLIENTS.17).

Of the 7,300 SHS clients with disability, 2,400 (33%) indicated that they received support from the NDIS.

For further information regarding the number of SHS clients receiving support through the NDIS see Clients, services and outcomes.

Service use patterns

The length of support clients with disability received increased in 2021–22 to a median of 92 days, up from 80 days in 2018–19. The median number of nights accommodated also increased, up from 50 in 2018–19 to 61 in 2021–22 (Supplementary table CLIENTS.46).

New or returning clients

Compared with all SHS clients, clients with disability were more likely to have received SHS assistance at some point since the collection began in 2011 (65% compared with 63% for all SHS clients). In 2021–22, more than 1 in 3 (35% or 2,500) clients with disability were new clients (Supplementary table CLIENTS.2 and CLIENTS.40).

Main reasons for seeking assistance

In 2021–22, the most common reasons for seeking assistance among clients with disability were (Supplementary tables DIS.5 and DIS.6):

  • housing crisis (28% or 2,000 clients); most common for clients experiencing homelessness (30% or 900 clients) and those at risk of homelessness (27% or around 1,000 clients)
  • family and domestic violence (18% or 1,300 clients)
  • inadequate or inappropriate dwellings conditions (14% or around 1,000 clients).

Services needed and provided

The top 6 needs reported by clients with disability were related to housing (provision of long-term housing and short-term or emergency housing) and general services related to information and advocacy (advice/information, other basic assistance, advocacy/liaison and material aid/brokerage) (Supplementary table DIS.2) (Figure DIS.3).

Figure DIS.3: Clients with disability, by services needed and provided, 2021–22

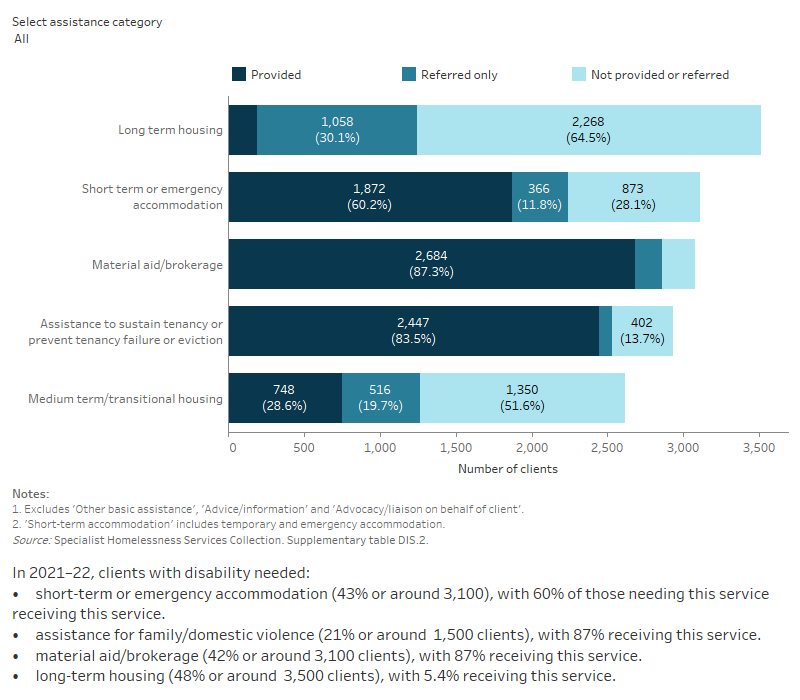
This interactive stacked horizontal bar graph shows the services needed by clients with severe or profound disability and their provision status. Advice/information was the most needed and the most provided service. Long term housing was the least provided.

In 2021–22 (Supplementary tables CLIENTS.24 and DIS.2) (Figure DIS.3):

  • Clients with disability were more likely to need help with living skills/personal development (24%), health/medical services (18%) and assistance for trauma (16%) than the general SHS population (17%, 9.0% and 12% respectively).
  • Almost 1 in 5 clients (18% or around 1,400) needed health/medical services. Most (78% or around 1,100) of these clients either received the services or were referred elsewhere for services.
  • Over 1 in 5 clients (21% or 1,500) needed assistance for family and domestic violence and 87% (or about 1,400) of clients with these identified needs were provided with assistance and 3.3% (51 clients) were referred.

Housing situation and outcomes

Outcomes presented here highlight the changes in clients’ housing situation at the start and end of support. That is, the place they were residing before and after they were supported by a SHS agency. The information presented is limited to those clients who were no longer receiving ongoing support from a SHS agency. In particular, information on client housing situations at the start of their first period of support during 2021–22 is compared with the end of their last period of support in 2021–22. As such, this information does not cover any changes to their housing situation during their support period.

At the start of support, more clients with disability were at risk of homelessness (almost 2,500 or 57%) than experiencing homelessness (1,900 or 43%). Among those experiencing homelessness, most were living in short-term temporary accommodation (20%) or were couch surfing (13%) (Supplementary table DIS.3).

By the end of support, more clients with disability who were at risk of homelessness (88% or 2,100 clients) were housed than those experiencing homelessness (43% or 740 clients). The most common housing situation at the end of support for those at risk of homelessness was private rental accommodation (1,200 clients or 53%); short-term temporary accommodation for those experiencing homelessness (480 or 28%) (Supplementary table DIS.4) (Figure DIS.4).

Figure DIS.4: Housing situation for clients with disability with closed support, 2021–22

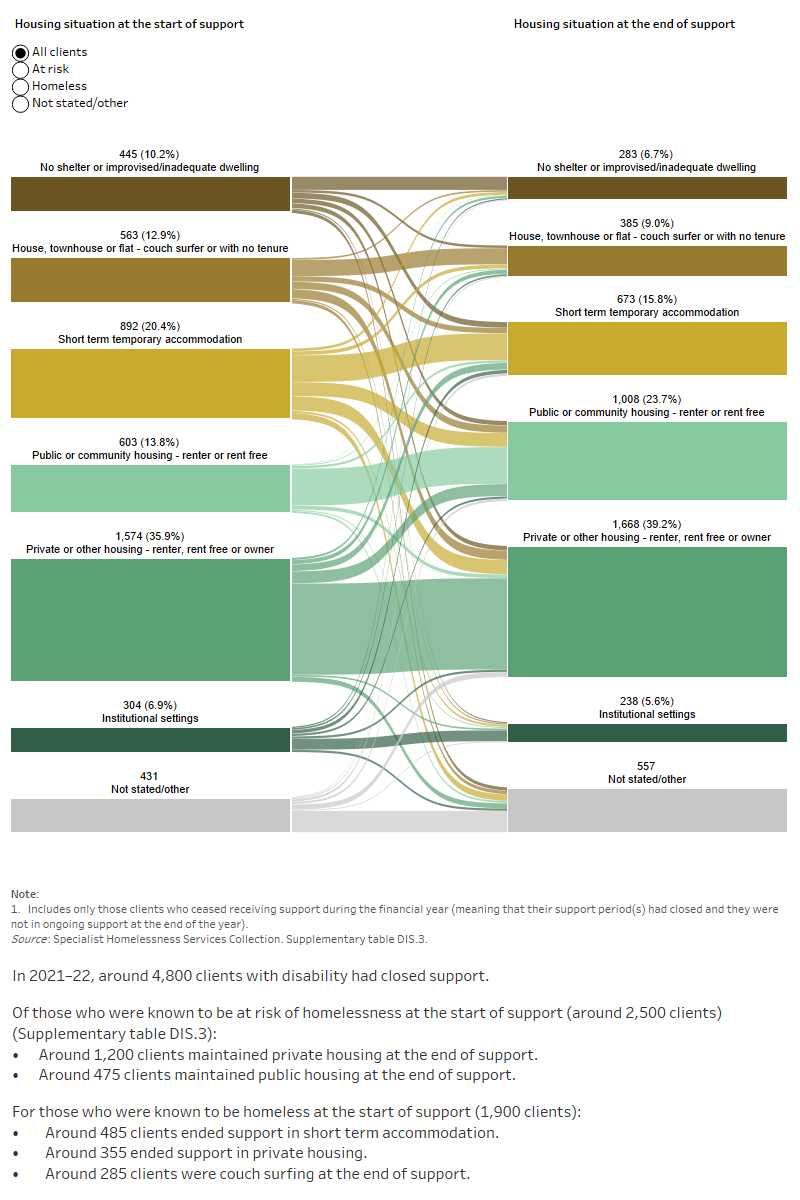
This interactive Sankey diagram shows the housing situation (including rough sleeping, couch surfing, short term accommodation, public/community housing, private housing and Institutional settings) of clients with sever or profound disability with closed support periods at first presentation and at the end of support. The diagram shows clients’ housing situation journey from start to end of support. Most started and ended support in private housing.

For more information on people with disability, see People with disability in Australia, AIHW.