Overview
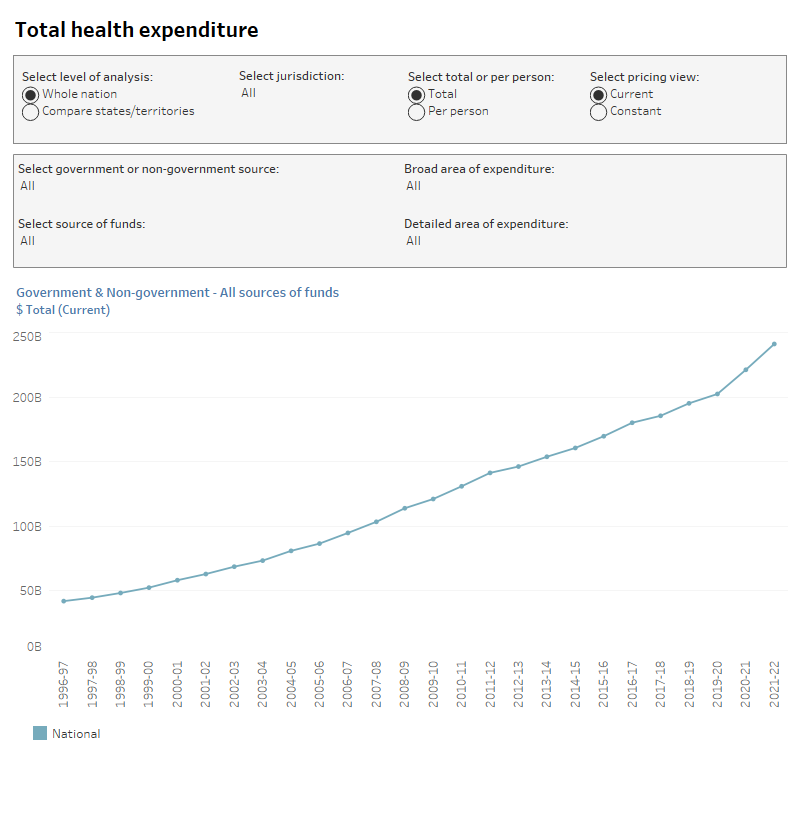
‘Overview’ tab represents an overview of total health spending, constant prices or current prices in Australia as a whole nation as well as each state and territory in the period from 1996–97 to 2021–22. This tab presents the total health spending by sources of funds and areas of expenditure. The tab also shows health spending per person in Australia as a whole nation as well as each state and territory.
‘Sources and Areas’ tab shows health spending, constant prices or current prices, by areas of spending and source of funds in Australia in the period from 1985–96 to 2021–22. This tab also presents proportions of health spending by sources of funds/areas of spending in the total health spending for Australia.
‘Spending by state’ tab illustrates total health spending, constant prices or current prices, by each state and territory, in the period from 1996–97 to 2021–22. This tab also presents health spending per person, constant prices or current prices, by each state and territory, in the period from 1996–97 to 2020–21.