Other services
Estimated total spending on other health related services in 2021–22 was $17.1 billion. Of this:
- $6.6 billion was spent on administration
- $5.1 billion on aids and appliances
- $5.4 billion on patient transport services (Table A6).
Overall:
- non-government entities contributed $7.0 billion
- state and territory governments $5.7 billion
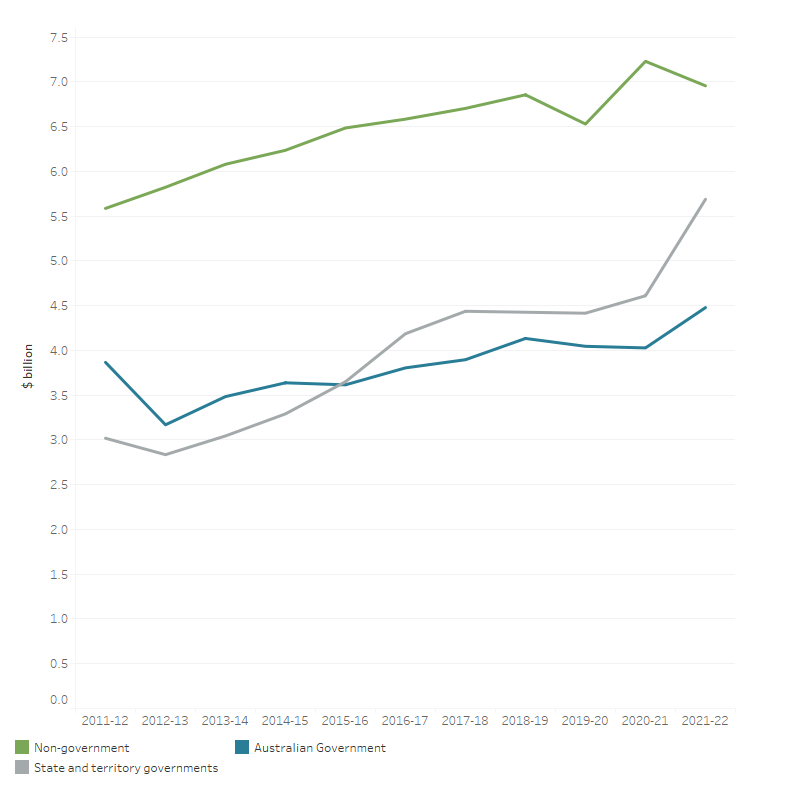
- Australian Government $4.5 billion (Figure 29).
Figure 29: Other services (a) spending, by source of funds, constant prices (b), 2011–12 to 2021–22
The line graph shows that spending on other services by Australian Government, state and territory government and non-government sector over the decade to 2021–22. Non-government spending increased from $5.6 billion in 2011–12 to $6.9 billion in 2018–19, then declined to $6.5 billion in 2019–20 before increased again to $7.0 billion in 2021–22. Australian Government spending increased less steadily, spiking to $3.9 billion in 2011–12 then decreasing to $3.2 billion in the following year, before gradually increasing to $4.1 billion in 2018–19, then was flat around $4.0 billion in 2019–20 and 2020–21 and then increased to 4.5 billion in 2021-22. State and territory government spending increased every year except for 2012–13 and was $3.0 billion in 2011–12 compared to $5.7 billion in 2021–22.

(a) Other services include patient transport services, aids and appliances, and administration.
(b) Constant price health spending is in 2021–22 prices.
Source: AIHW Health Expenditure Database (Table 34).
Compared with 2020–21, spending on other services increased in real terms by $1.3 billion (7.9%) in 2021–22. This growth was attributable mainly to an increase in spending by state and territory governments of $1.1 billion (23.4%). The Australian Government spending increased by $0.5 billion (11.2%) while non-government entities’ spending decreased by $0.3 billion (3.8%).
In the decade since 2011–12, the real average annual growth rate on other services was 3.2%.


