Government sources: Australian Government spending
On this page:
Australian Government spending
In 2021–22, Australian Government health spending was $105.8 billion, representing a $8.4 billion real increase (8.6%) from 2020–21 (Table 10). This was more than double the average annual real growth in the decade to 2021–22 (3.5%) and also higher than 2020–21 (7.6%).
The growth of Australian Government spending between 2020–21 and 2021–22 was due mainly to increases in direct Australian Government spending (10.1%) and grants to states and territories (9.2%) while the health spending associated with the health insurance premium rebate decreased by 1.9% and DVA spending decreased by 5.1% (Table 12). Among the direct Australian Government spending, the biggest increases were in public health (including spending on COVID-19 vaccines, anti-viral treatments and rapid antigen tests) and referred medical services (including diagnostic imaging, specialist services, among others).
Spending relative to government expenses
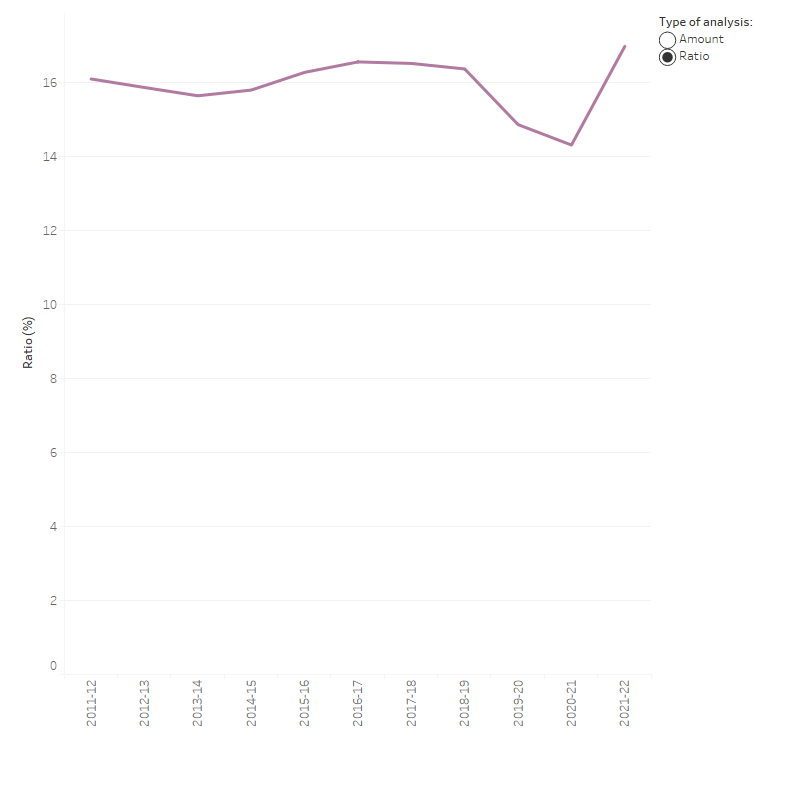
During 2021–22, the $105.8 billion health spending by the Australian Government was 17.0% of its expenses, approximately 2.7 percentage points higher than in 2020–21 (Figure 9). This is attributed to Australian Government nominal health spending growing faster than other areas of Australian Government spending (Table 11). More details on the Australian Government’s Economic Response to COVID-19 can be found on the Treasury website.
Figure 9: Ratio of Australian Government health spending to Australian Government expenses, current prices, 2011–12 to 2021–22
The line graph shows the dollar amounts of the Australian Government expenses, and health spending with one additional line showing the ratios of the Australian Government health spending to government expenses as a percentage. Australian government health spending increased from $61.1 billion in 2011–12 to $105.8 billion in 2021–22. Government expenses increased from $379.3 billion in 2011–12 to $623.1 billion in 2021–22. The highest ratio of 17.0 per cent was in 2021–22 and the lowest one was 14.3 per cent in 2020–21.
Sources: AIHW Health Expenditure Database; Australian Bureau of Statistics (ABS 2023c) (Table 11).
Spending programs
Australian Government spending in 2021–22 (Figure 10) comprised:
- direct Australian Government spending ($63.8 billion, or 60.3%), mostly administered through the Department of Health and Aged Care (DoHAC) on programs for which the government has responsibility, such as the MBS, PBS, and health research. This also includes some health spending by the Department of Defence ($568 million).
- grants to states and territories ($33.0 billion, or 31.1%), including National Health Reform funding (mainly comprising public hospital funding), National Partnership on COVID-19 Response (NPCR), other National Partnership Payments (NPPs) and the PBS Section 100 funding in public hospitals.
- rebates and subsidies for privately insured people under the national Private Health Insurance Act 2007 ($6.3 billion, or 5.9%)
- DVA funding for goods and services provided to eligible veterans and their dependants ($2.8 billion, or 2.7%)
The 8.6% increase in Australian Government health spending between 2020–21 and 2021–22 can be attributed to increases in spending through specific DoHAC programs ($5.9 billion increase) and funding to states and territories through grants ($2.8 billion increase). The main driver of this increase was COVID-19 related health spending funded by the Australian Government such as spending on COVID-19 vaccines, rapid antigen tests, and personal protective equipment.
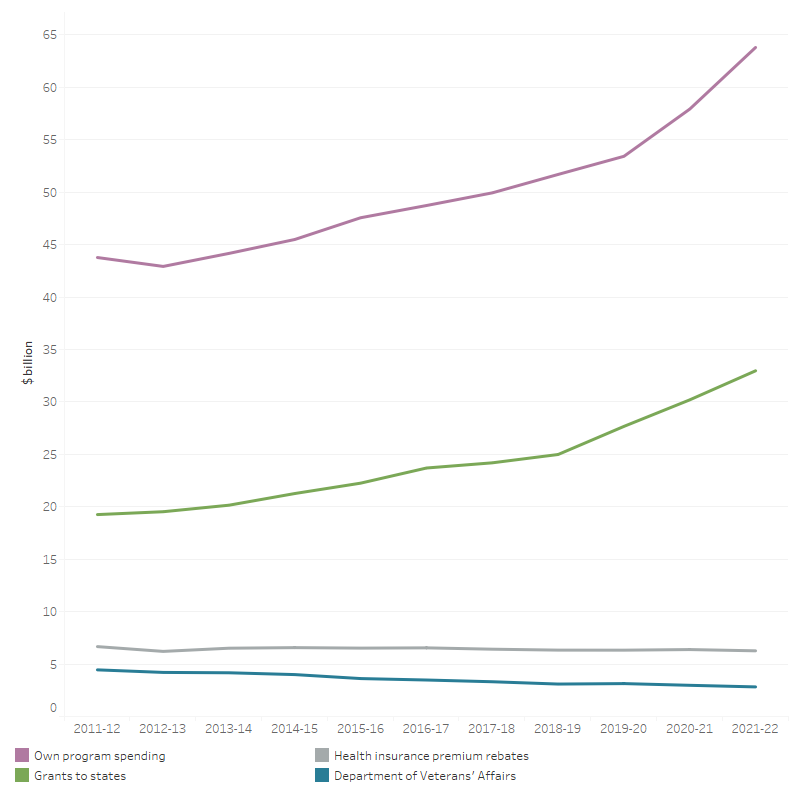
Figure 10: Australian Government total health spending by program, constant prices (a), 2011–12 to 2021–22
The line graph shows that from 2011–12 to 2021–22 the Australian Government spent the most to least on their own program spending, grants to states, health insurance premium rebates and Department of Veterans’ Affairs. Over the 10-year period, there was an overall increase in health spending by the Australian Government for each program excluding on Department of Veterans’ Affairs. In 2021–22, The Australian Government spent $63.8 billion on own program spending, $33.0 billion on grants to states, $6.3 billion on health insurance premium rebates and $2.8 billion on Department of Veterans’ Affairs.
(a) Constant price health spending is in 2021–22 prices.
Notes:
- Australian Government own program spending, mostly administered through the Department of Health and Aged Care on programs for which the government has responsibility, such as the MBS, PBS, health research and capital consumption. This also includes some health spending by the Department of Defence since 2019–20
- Grants to states include the Commonwealth Government National Health Reform funding, National Partnership on COVID-19 Response (NPCR), other National Partnership Payments (NPPs) and the funding of PBS section 100 programs in public hospitals.
- Spending on the medical expenses tax rebate is not included.
- Tax revenue has been deducted from Australian Government own program spending.
Source: AIHW Health Expenditure Database (Table 12).
COVID-19 related health spending funded by the Australian Government in 2021–22
The pandemic impacted health spending in many ways, often through increasing the cost and complexity of service delivery in ways that are difficult to quantify. There were, however, some large COVID-19–specific response programs, such as the National Partnership on COVID-19 Response (NPCR) and spending on COVID-19–related programs by the Australian Government Department of Health and Aged Care (DoHAC, including Medicare Benefits Scheme (MBS) and Pharmaceutical Benefits Scheme (PBS)).
During 2021–22, there was an estimated $18.7 billion spent through these programs ($6.6 billion on the NPCR and $12.1 billion on the DoHAC programs).
Spending on the National Partnership on COVID-19 Response
During 2021–22, the Australian Government spending through the NPCR was $6.6 billion. This comprised
- hospital services payments ($1.9 billion, or 28.4%)
- state public health payments ($4.3 billion, or 64.9%)
- private hospital financial viability payment ($0.4 billion, or 6.7%).
Australian Government spending through DoHAC programs
In 2021–22, DoHAC spending on specifically identifiable COVID-19 programs was estimated to be $12.1 billion. The distribution of the spending in 2021–22 included:
- 44.4% (5.4 billion) on COVID-19 vaccinations (mainly provided access to, and delivery of, COVID-19 vaccines)
- 31.0% ($3.8 billion) on COVID-19–related medical services (mainly related to COVID-19 vaccine suitability assessment services, as well as other referred and unreferred medical services through MBS-funded telehealth)
- 9.2% ($1.1 billion) on COVID-19 testing (mainly through MBS-funded COVID-19 testing including rapid antigen test kits)
- 8.4% ($1.0 billion) on COVID-19 medical goods and equipment (mainly related to distribution of masks and personal protective equipment products for the national medical stockpile)
- 6.8% ($0.8 billion) on Other COVID-19–related health spending (largely related to mental health programs, and public health mainly related to primary care respiratory clinics)
- 0.3% ($34 million) on COVID-19–related investments.
Note that COVID-19 related spending for residential aged care is outside the scope of this report. This also does not include COVID-19 related spending by other Australian Government agencies, which might fall into a broader scheme of economic response to COVID-19 .
MBS, PBS and RPBS government benefits paid in 2021–22
In 2021–22, the Australian Government funded $28.6 billion as government benefits paid for MBS services.
During the same year, the Australian Government funded $12.1 billion as subsidies for PBS and $0.3 billion for RPBS pharmaceuticals.
Area of spending
During 2021–22, more than one-third (38.8%) of Australian Government health spending was for primary health care ($41.1 billion) (Figure 11). Of this:
- pharmaceuticals subsidised through the PBS (not including Section 100 drugs and other drugs that could be allocated to the areas of public hospital services and private hospitals) contributed $11.8 billion.
- unreferred medical services (mainly visits to a general practitioner) was $11.4 billion.
- public health was $9.1 billion.
- other health practitioners was $2.8 billion (Table A6).
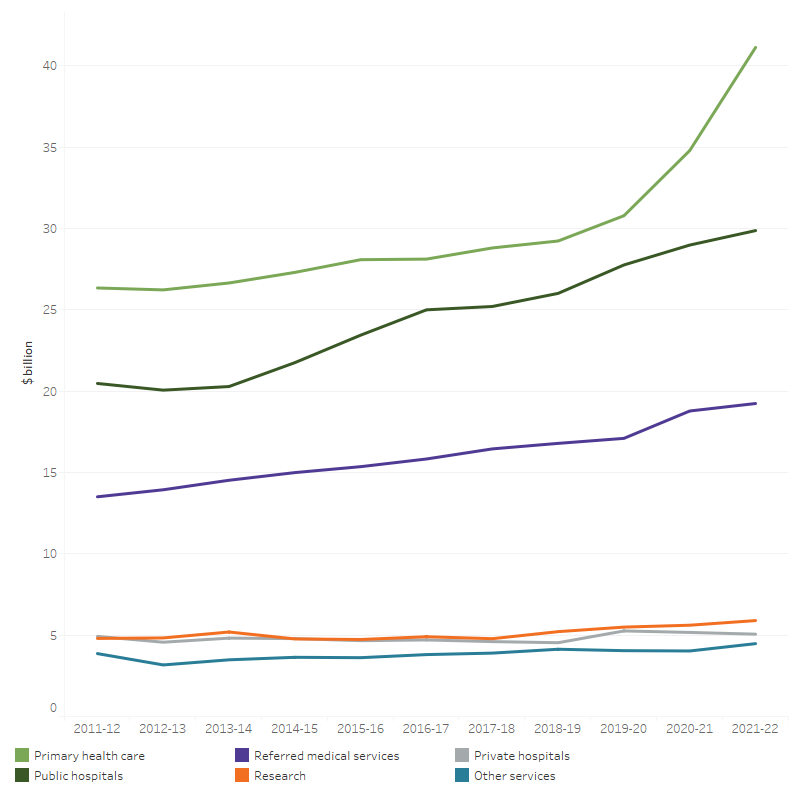
Figure 11: Australian Government health spending, by area of spending, constant prices (a), 2011–12 to 2021–22
The line graph shows that from 2011–12 to 2021–22 Australian Government health spending increased in public hospitals, primary health care, referred medical services, research and other services. In 2021–22, health spending was $41.1 billion on primary health care, $29.9 billion on public hospitals, $19.2 billion on referred medical services, $5.9 billion on research, $5.1 billion on Private hospitals, $4.5 billion on Other services, and $191 million on capital.
(a) Constant price health spending is in 2021–22 prices.
Notes:
- Other services include patient transport services, aids and appliances, and administration.
- Spending on the medical expenses tax rebate and capital is not included.
Source: AIHW Health Expenditure Database (Table 13).
Spending on public hospitals was the next largest area of Australian Government health spending (between $29.9 billion and $31.5 billion depending on how some MBS benefits for services provided in public hospitals are treated), followed by referred medical services ($19.2 billion or $16.0 billion also depending on how some MBS spending is treated) (Figure 11, Table A11b).
The estimated spending on public hospitals and referred medical services by the Australian Government is represented as a range here to reflect additional components of MBS spending that have not historically been treated as public hospital spending in the national health accounts methodology but that are believed to be related to services provided in public hospitals.
MBS funding by the Australian Government in public and private hospitals
The lower bound of $29.9 billion of the Australian Government spending on public hospital services includes spending by the Department of Veteran’s Affairs (DVA), National Health Reform funding, PBS section 100 programs (Highly Specialised Drugs, PBS Efficient Funding of Chemotherapy program, Chemotherapy Pharmaceutical Access Program (CPAP) and the Special Authority Program (trastuzumab - Herceptin), Botulinum Toxin Program, and Human Growth Hormone program) delivered through hospitals, a small grouping of other National Partnership Payments, an allocation of the private health insurance premium rebates, some specific programs administered by the Australian Government Departments of Health and Defence and capital consumption allocated to public hospitals. More details can be found in Table A11.
This amount currently does not include:
(i) Government benefits paid for in-hospital MBS, mostly for private patients in public and private hospitals. This includes both inpatients and outpatients (at public hospitals’ outpatient clinics). The majority of these components are currently allocated to Referred medical services. This is primarily because limitations in the MBS data mean public hospital spending cannot be directly derived, including:
(i.1) Only MBS payments for medical services provided to admitted patients are flagged as ‘in hospital’. Outpatient and non-medical services are not recorded as hospital services.
(i.2) MBS ‘in-hospital’ services cannot be differentiated by services provided to private patients in a private hospital versus services provided to private patients in a public hospital.
(i.3) In addition, MBS payments are generally made to individual patients and individual practitioners, rather than directly to hospitals. There are, however, arrangements in place, particularly between practitioners and hospitals, that can mean that part or all of the MBS benefits are passed on to the hospital in lieu of payments from patients or fees for private practice arrangements for practitioners in public hospitals. A lack of detail regarding exactly who ultimately receives the MBS benefits and these payments are treated in data provided by both the Australian Government and the states and territories has meant that there is currently no consensus as to how best to treat this revenue in the ANHA.
While these limitations currently prevent the full incorporation of these MBS components into the area of public and private hospital spending, the AIHW has worked and will continue to work with the HEAC to develop a method for quantifying the amount of spending involved for the MBS components and to better understand the likely flow-on impact for other spending categories such as referred medical services and benefit-paid pharmaceuticals.
The estimated quantities of these components are provided below for both public and private hospitals. This does not include an estimate of the non-medical components for the MBS for private hospitals as there is no data currently available to quantify this.
In terms of the flow-on impacts, the full inclusion of this new way of categorising this spending into the ANHA would result in reductions to the estimates for referred medical services (as spending is reallocated to hospitals) in addition to increasing the Australian Government contributions for both public and private hospitals.
The full inclusion would also be likely to result in reductions to public hospital spending estimates for Individuals and potentially State and territories, however the full effects require further work with HEAC to determine.
Private hospitals spending would not be associated with the same degree of flow-on issues because the current estimation methods already exclude these amounts.
Table: Estimates of Australian Government’s spending in public and private hospitals, including in-hospital MBS, 2021–22 ($ million)
Current figure | MBS for admitted patients | MBS for non-admitted patients | Total estimates | |
|---|---|---|---|---|
Public hospitals | 29,864 | 734 | 865 | 31,462 |
Private hospitals | 5,061 | 2,459 | 0 | 7,521 |
Total hospitals | 34,925 | 3,193 | 865 | 38,982 |
The AIHW is continuing to work with data providers and HEAC to resolve outstanding issues and fully incorporate these new estimates into the ANHA.
Using the current estimates, the rise in total Australian Government spending between 2020–21 and 2021–22 was mostly due to an increase of $6.3 billion on primary health care (mostly public health by $4.9 billion, including spending on COVID-19 vaccines, rapid antigen tests, personal protective equipment; community health and other by $1.7 billion), public hospitals by $0.9 billion, referred medical services by $0.5 billion (including spending on COVID-19 testings, diagnostic imaging, specialist services, among others), and other services by $0.5 billion (Figure 11).
Over the decade since 2011–12, primary health care had the highest average annual growth rate by the Australian Government (4.6% per year), followed by public hospital services (3.8% per year) and referred medical services (3.6% per year) (Figure 11). Note that growth calculations for Australian Government public hospital funding do not include additional components of MBS spending as stated above.
Private health insurance premium rebates
In 2021–22, the rebate for private health insurance premiums paid by the Australian Government was $6.3 billion, a real decrease of $121 million from 2020–21 (Figure 12). The rebate amount presented here is an estimate of the rebate paid out as benefits (to estimate health spending). This is done to exclude spending on non-health related items such as health insurance advertising. It is therefore smaller than the total rebate paid to individuals to reduce premiums, which are reported elsewhere (such as in DoHAC and ATO annual reports). More details on the estimation can be found in the Australian National Health Account: concepts, methodology and data sources.
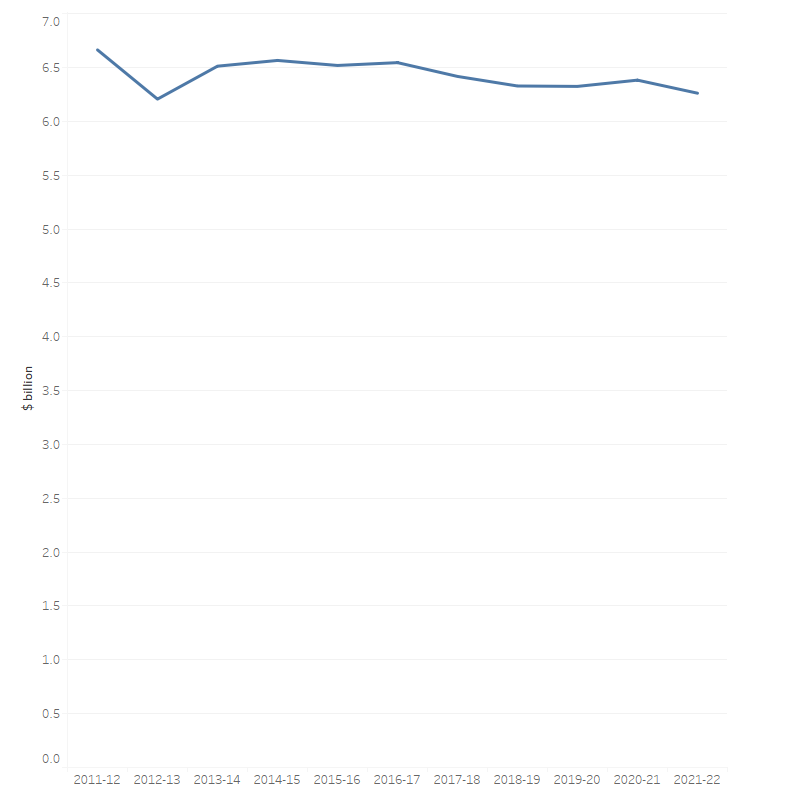
Figure 12: Health insurance premium rebates as health spending, constant prices (a), 2011–12 to 2021–22
The line graph shows that health insurance premium rebates decreased from $6.7 billion in 2011–12 to 6.2 billion in 2012–13 and after that fluctuated around $6.2 billion to $6.5 billion.
(a) Constant price health spending is in 2021–22 prices.
Notes:
- The premium rebate is pro-rated across all expense categories (including change in provisions for outstanding claims). The rebate includes rebates paid through the tax system as well as rebates paid to funds, which directly reduce premiums.
- Other services include patient transport services, aids and appliances, and administration.
Source: AIHW Health Expenditure Database (Table 14).
Department of Veterans’ Affairs spending
In 2021–22, the DVA spent $2.8 billion on health, mostly on hospitals ($1.0 billion), primary health care ($0.7 billion) and referred medical services ($0.6 billion). Total DVA spending decreased by 5.1% in 2021–22 (Figure 13a). Note that DVA changed their reporting system of health expenditure since 2020–21 which has some impacts on the time series of health spending in this report. Therefore, caution should be exercised when comparing results between years.
DVA spending on hospitals declined over the decade to 2021–22, with public hospitals decreasing by an average of 8.8% per year and private hospitals by 6.4% in real terms. Once again, note that the change of DVA reporting system affected the growth rates over the years. DVA spending on primary health care also decreased in real terms by a yearly average of 4.1%, accompanied by an average decrease in spending on referred medical services by 2.2%. During this period, Other services (including Patient transport services, Aids and appliances, and Administration) increased by 4.5%.
Based on the number of people in the DVA treatment population (which includes all DVA Orange, Gold and White cardholders), DVA spent $10,190 on health per member of the treatment population in 2021–22 which is 8.8% higher than the health spending per person in the total Australian population ($9,365). This average health spending per member of the DVA treatment population peaked in 2014–15 and decreased over the period 2015–16 to 2021–22 (Figure 13b). This recent downward trend in the health spending per member of the DVA treatment population is due to the decline in the number of Veteran Gold Card Holders and increase in those of Veteran White Card Holders. DVA will pay for the hospital treatment costs for Veteran White Card holders for accepted conditions or conditions under non-liability health care whereas all hospital services that meet the clinical needs of Veteran Gold Card holders are paid by DVA.
Figure 13a: Department of Veterans’ Affairs health spending by area of spending, constant prices (a), 2011–12 to 2021–22
The line graph shows that Department of Veterans’ Affairs spent the most on primary health care and least on research. In 2021–22, $427.9 million was spent on public hospitals, $604.5 million on private hospitals, $748 million on primary health care, $648.4 million on referred medical services, and $388.6 million on other services.
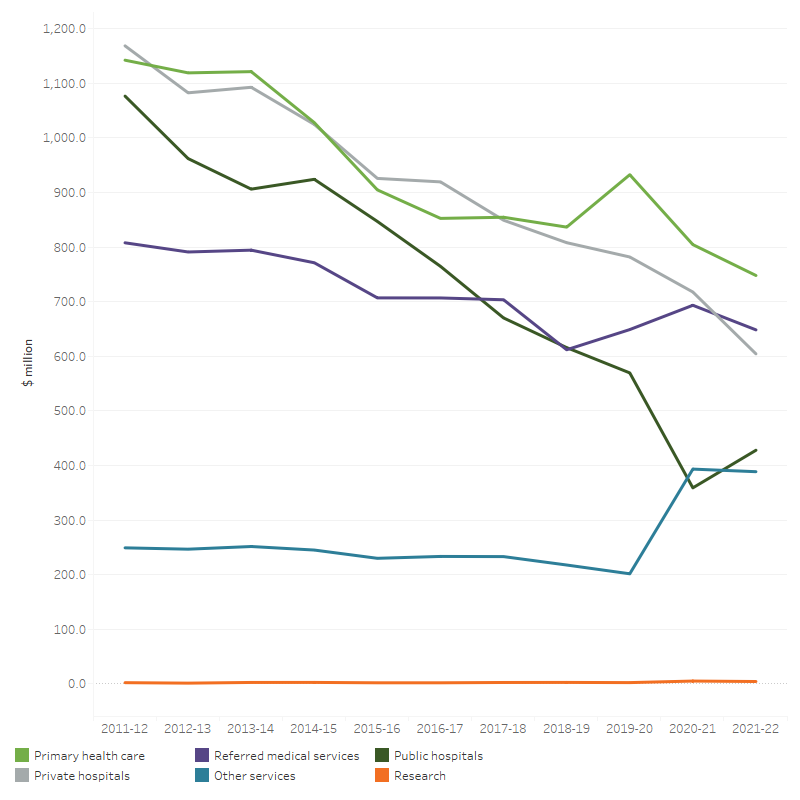
(a) Constant price health spending is in 2021–22 prices.
Source: AIHW Health Expenditure Database (Table 15).
Figure 13b: Average health spending per client of the DVA treatment population and per person in the Australian resident population, constant prices (a), 2011–12 to 2021–22 ($)
Average health spending per client of DVA treatment population increased from $18,391 in 2011–12 to $18,770 in 2014–15, and then decreased to $10,190 in 2021–22. Health spending per member of DVA treatment population is often higher than the health spending per person in the total Australian population during the 10-year period.
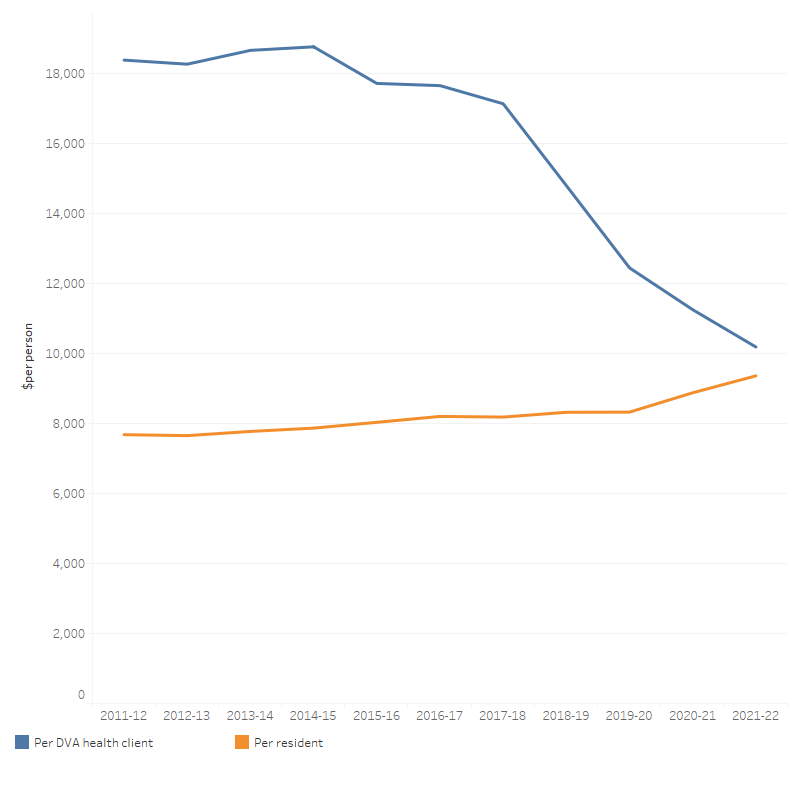
(a) Constant price health spending is in 2021–22 prices.
Sources: AIHW Health Expenditure Database; Australian Bureau of Statistics (2023a); Department of Veterans' Affairs (2022) (Table 15)
Department of Defence health spending
In 2021–22, the Department of Defence (Joint Health Command) spent $568 million on heath. This was a decrease of 4.2% ($25.0 million) from 2020–21 in real terms. In 2021‑22, the biggest area of spending was other health practitioners ($164 million), followed by referred medical services ($128 million), unreferred medical services ($88 million), private hospitals ($74 million), dental services ($52 million) and administration ($37 million).
The amounts shown represent actual health expenditure by the Department of Defence for its ADF and APS employees that could be categorised as per AIHW’s area of expenditure classification, including direct spending on health care to members, direct costs of pharmaceuticals purchased by the Department and costs for administration, including the Defence electronic health record.
Note that it is not possible to reconcile this exactly against other departmental financial reporting because some expenditure within the Joint Health Command is not related to patient care and because of the accounting practices (e.g. cost accrual) employed in departmental reporting. There are also areas of health expenditure within the Department that cannot be extracted from Departmental reporting such as building maintenance and other infrastructure costs and material used within the operational environment.