Sources and areas
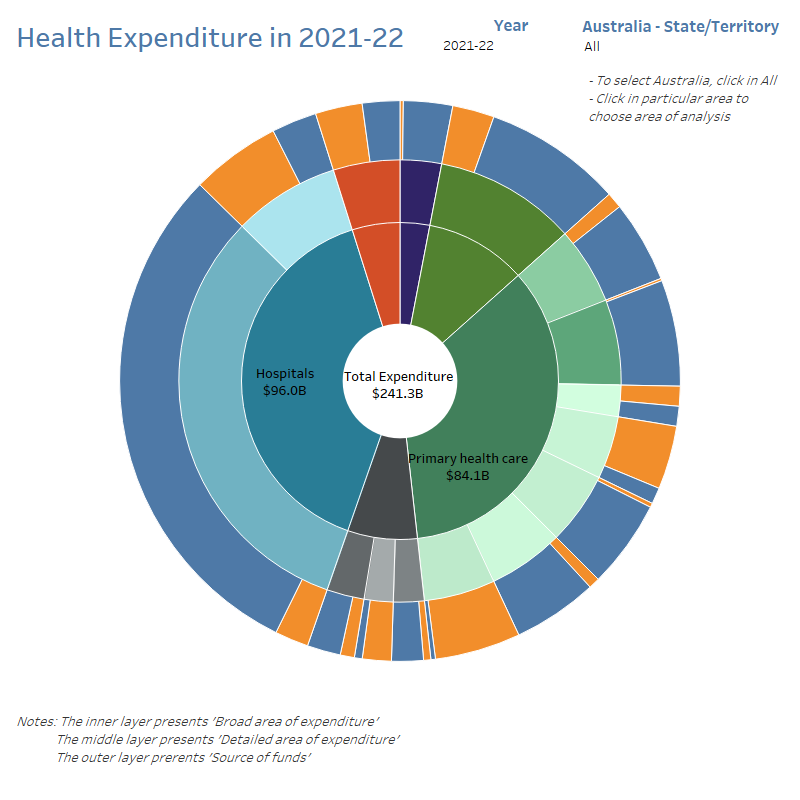
‘Sunburst_area_source’ graph illustrates the areas of expenditure and source of funds, using constants prices, in the period from 1996-97 to 2021-22. It includes 4 layers, the centre layer presents the total of expenditure for each area or year, the second layer presents broad area of expenditure, the third layer presents detailed area of expenditure, and the outer layer presents the source of funds. For each area of expenditure or source of funds, it can be filtered by year or for Australia or each State/Territory.
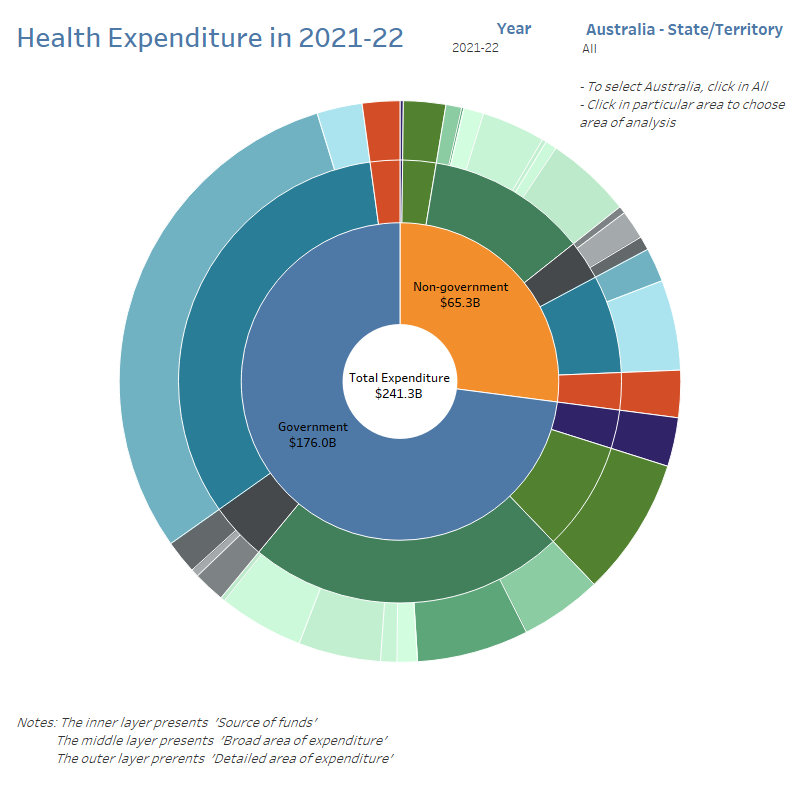
‘Sunburst_source_area’ graph describes the source of funds and area of expenditure, using constants prices, in the period between 1996-97 to 2021-22. It includes 4 layers, the centre layer presents the total of expenditure for each area or year, the second layer presents source of fund, the third layer presents broad area of expenditure, and the outer layer presents the detailed area of expenditure. For each area of expenditure or source of funds, it can be filtered by year or for Australia or each State/Territory.