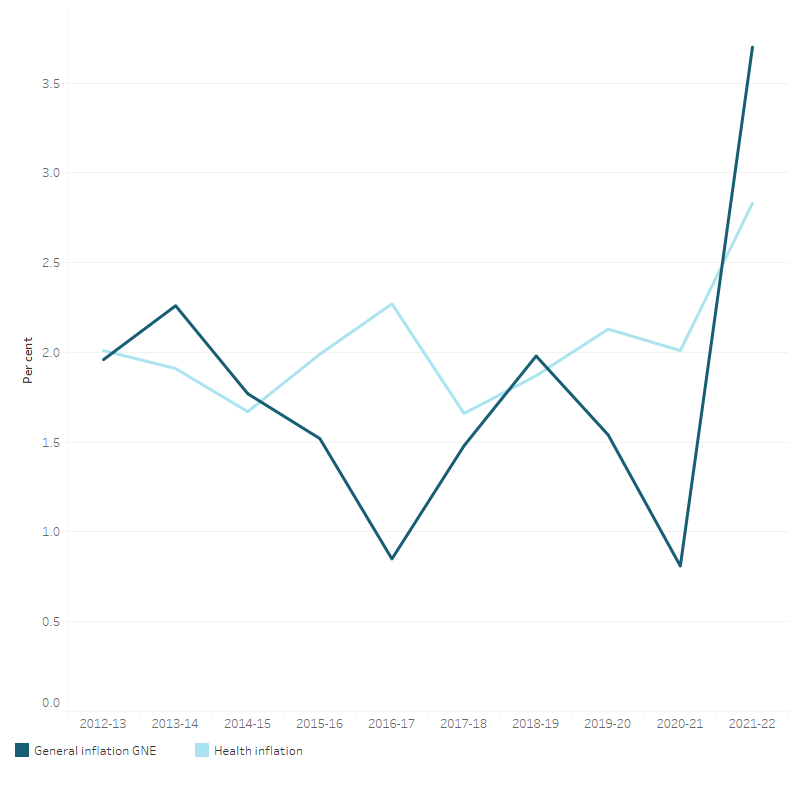
(a) Health inflation based on the AIHW Total Health Price Index.
(b) General inflation based on the IPD for GNE.
Sources: AIHW Health Expenditure Database; Australian Bureau of Statistics (ABS 2023b) (Table 6).
Inflation and deflators
Inflation refers to changes in prices over time. It can be positive (prices are rising over time and the same volume of goods cost more, so money is losing value) or negative (the same volume of goods is costing less).
Inflation in the broader economy is measured using price indexes, also known as deflators. These show the amount a price has changed over time relative to a base year. The reference year, or base year, for the deflators used in this report is 2021–22.
Health inflation
Health inflation is a measure of the average rate of change in prices within the health goods and services sector of the economy.
See Concepts and definitions: Deflators for more information on health deflators and industry-wide deflators.
General inflation
General inflation refers to the average rate of change in prices throughout the economy over time. There are different ways to measure the economy, and many methods for deriving deflators. The specific deflator can affect whether prices in the health sector appear to have risen slower or faster than the general inflation rate (excess health inflation).
In this report, the measure used for this is the IPD for GNE. GNE is a measure of the value of final expenditures on the goods and services purchased in the economy by all parties including governments and including imports but excluding exports. IPD is an indicator of changes in the purchase price of these goods.
Excess health inflation
Excess health inflation is the amount by which the rate of health inflation exceeds general inflation. Excess health inflation will be positive when health prices are rising more rapidly than prices generally throughout the economy. It will be negative when the general level of prices throughout the broader economy are rising more rapidly than health prices.
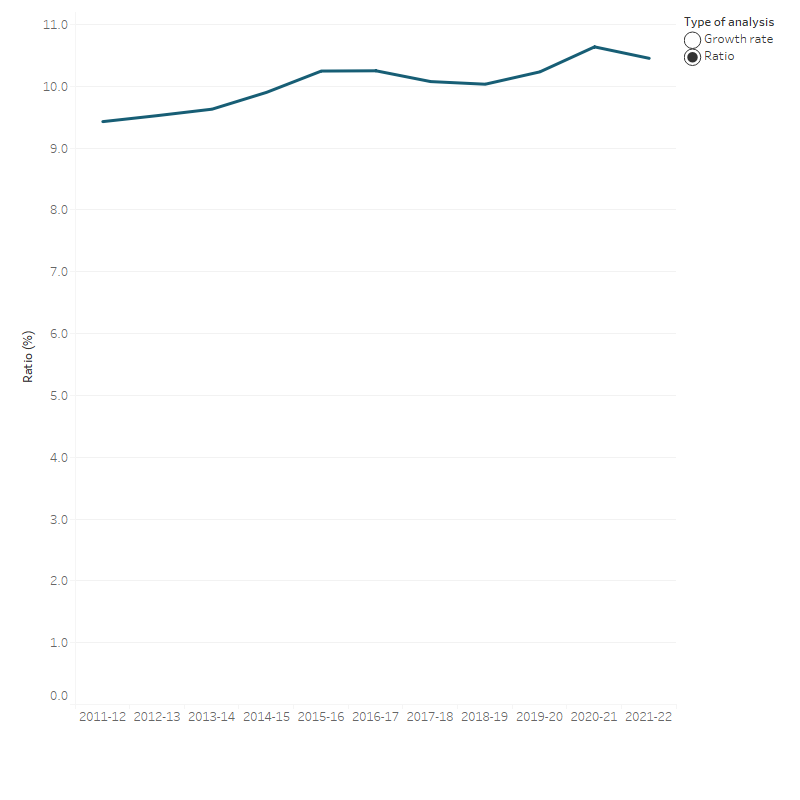
Health spending and gross domestic product
The ratio of health spending to GDP, showing the proportion of total economic activity represented by the health sector, is an indicator of the contribution of health spending to the overall economy.
In 2021–22, health spending accounted for 10.5% of GDP in Australia, approximately 0.2 percentage points lower than in 2020–21 (Figure 6). The ratio of total health spending to GDP increased gradually during the first half of the decade (2011–12 to 2016–17), then flattened out. It increased in the past two years, reaching to 10.6% in 2020–21 before decreasing in 2021–22.
See International comparison of health spending for comparing the ratios of the health spending to GDP among OECD countries.