Government sources: State and territory government spending

State and territory government spending

In 2021–22, state and territory governments spent $70.2 billion on health. In real terms, this was an 11.0% growth in spending from 2020–21 – an additional $6.9 billion (Table 10). This real growth rate was higher than the average growth rate over the period from 2011–12 to 2021–22 (4.0% per annum). 

Spending relative to government expenses

In 2021–22, the ratio of state and territory government health spending to their total state and territory government expenses was 17.6%, similar to the ratio in 2020–21 (Figure 14) (Table 16).

Figure 14: Ratio of state and territory government health spending to state and territory government expenses, current prices, 2011–12 to 2021–22

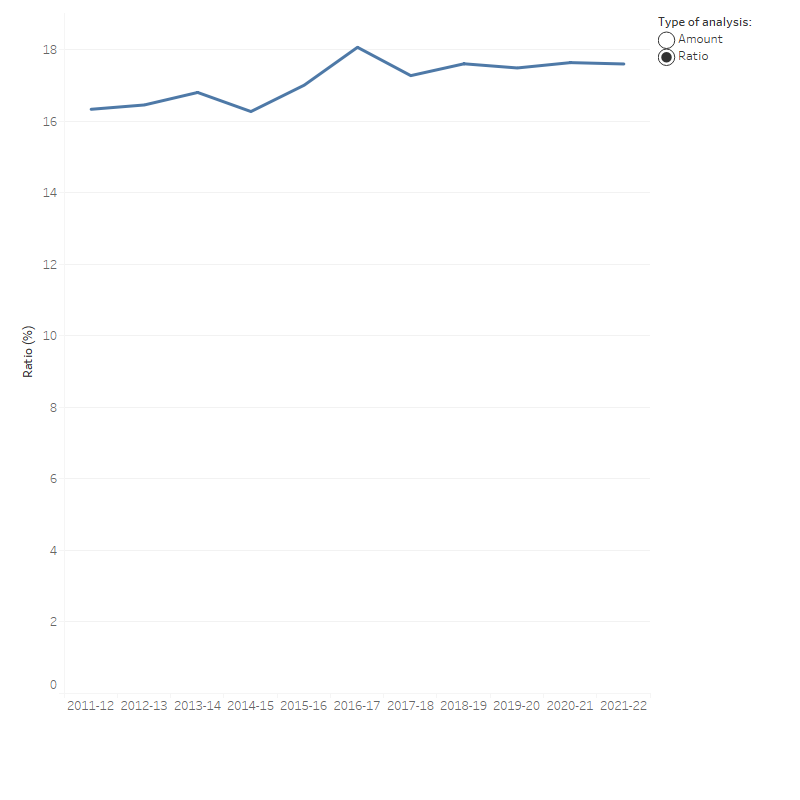
The line graph shows the dollar amounts of the state and territory government expenses and health spending with additional line showing the ratios of the state and territory government health spending to government expenses as a percentage. State and territory government health spending increased from $38 billion in 2011–12 to $70.2 billion in 2021–22. Government expenses increased from $232.5 billion in 2011–12 to $398.7 billion in 2021–22. Ratio of health spending to government expenses increased over the 10-year period from 16.3 per cent to 17.6 per cent.

Notes:

  1. State and territory government expenses comprise these government expenses from state and local governments.
  2. The ratio increased in 2016–17 due to a large one-off capital spending project in South Australia.
  3. For more information about concepts, definitions and data sources, see Overview of data sources and methodology of Health Expenditure Australia 2021–22 report.

Sources: AIHW Health Expenditure Database; Australian Bureau of Statistics (ABS 2023c) (Table 11).

In 2021–22, the ratio of health spending to government expenses differed across state and territories, with the highest in Tasmania (24.6%) and lowest in New South Wales (14.4%) (Figure 15). The ratio increased for Victoria, Queensland, Western Australia, South Australia, Tasmania and the Northern Territory in 2021–22 while declined for the others.

Figure 15: Ratio of total health spending to government expenses for each state and territory government, current prices, 2011–12 to 2021–22

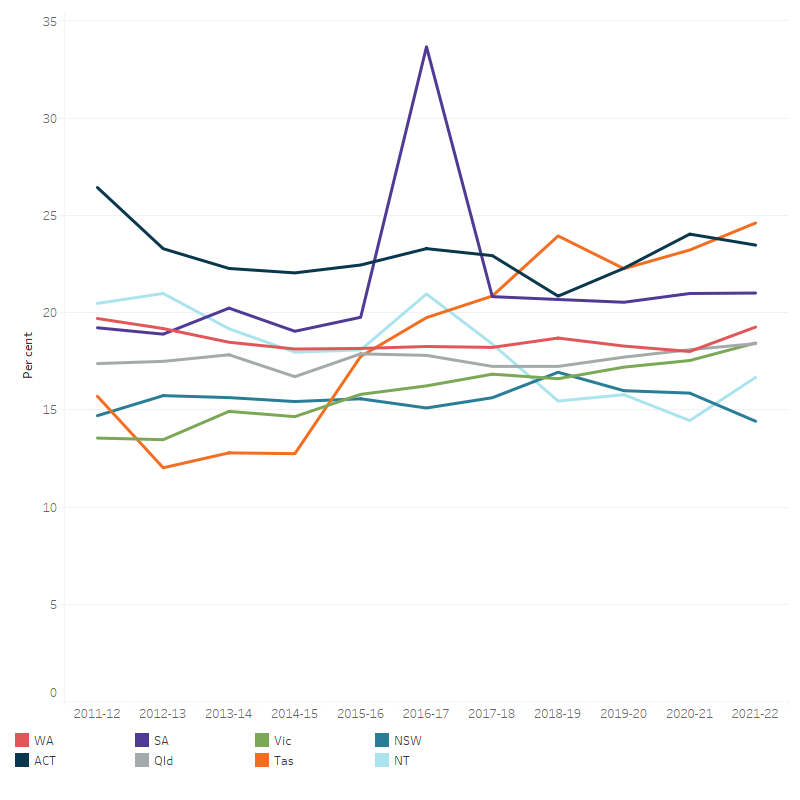
The line graph shows that ratio of health spending to government expenses for all states and territories from 2011–12 to 2021–22. Over the 10-year period, the list of average ratios from highest to lowest is Tasmania (24.6 per cent), Australian Capital Territory (23.5 per cent), South Australia (21.0 per cent), Western Australia (19.3 per cent), Victoria (18.4 per cent), the Queensland (18.4 per cent), the Northern Territory (16.7 per cent) and New South Wales (14.4 per cent). The ratio increased significantly in 2016–17 for South Australia due to a large one-off capital spending project. 

Notes: 

  1. Government expenses include these government expenses from state and local governments.
  2. The ratio increased in 2016–17 due to a large one-off capital project in South Australia.

Sources: AIHW Health Expenditure Database; Australian Bureau of Statistics (ABS 2023c) (Table 17).

Area of spending

In 2021–22, state and territory governments spent $43.8 billion (62.5%) on hospitals, with the most ($42.6 billion) on public hospitals. Another $14.7 billion (21.0%) was spent on primary health care; of which community health services and public health were $7.3 billion, $6.5 billion respectively (Figure 16; Table A6).

In 2021–22, state and territory spending increased in real terms in these main areas:

  • public hospital services by $4.7 billion (12.4% increase compared with 2020–21)
  • public health by $2.6 billion (68.1% increase)
  • other services (patient transport services, aids and appliances, administration) by $1.1 billion (23.4% increase).

Spending on capital decreased by $1.0 billion (16.3%). 

Figure 16: State and territory government total health spending, by area of spending, constant prices (a), 2011–12 to 2021–22

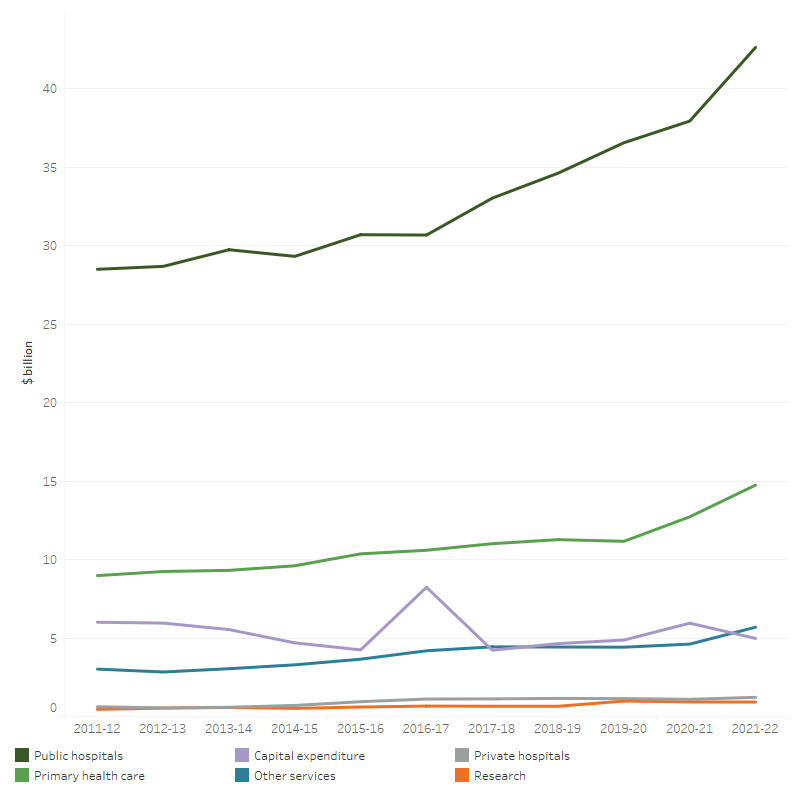
The line graph shows that state and territory government health spending increased from 2011–12 to 2021–22 in all areas of spending. For the overall 10-year period, the largest increase was for public hospitals ($28.5 billion in 2011–12 to $42.6 billion in 2021–22), followed by primary health care ($9.0 billion in 2010–12 to $14.7 billion in 2021–22). State and territory government health spending was relatively flatter for private hospitals, other services and research. Capital spending by state and territory government increased in 2016–17 due to a large one-off capital spending project in South Australia. 

(a) Constant price health spending is in 2021–22 prices. 

Notes

  1. There was no state and territory government spending on referred medical services.
  2. Primary health care excludes unreferred medical services, benefit-paid pharmaceuticals and all other medications.
  3. Other services exclude aids and appliances.
  4. State and territory government capital spending increased in 2016–17 due to a one-off capital spending in South Australia.

Source: AIHW Health Expenditure Database (Table 18).

These estimates of public hospital spending differ from those reported in the NHFB statistics for a range of reasons, including where funding is provided to support public hospital service delivery outside the NHFP. More details can be found in Comparison and alignment of Australian health expenditure estimates.