Health spending per person

Taking into account population size and growth, average per capita spending on health in 2021–22 was $9,365. In real terms, this was $484 (5.4%) more per person than in 2020–21 (Figure 2a). Before 2020–21, per capita spending had grown with the modest rates of 1.7% in 2018–19 and 0.1% in 2019–20, then reached high growth rates in 2020–21 and 2021–22 of 6.6% and 5.4% respectively. The growth in per capita spending on health in 2021–22 was higher than the average yearly increase over the decade to 2021–22 (2.0%) and higher than might have been expected based on the background trend (between 2008–09 and 2018–19) (Figure 2b). 

The continued increase in per capita spending in 2021–22 from the low base in 2019–20 can be attributed to the impact of the COVID-19 pandemic which resulted in increased health spending and decreased population growth. The growth rates of health spending in 2020–21 and 2021–22 were 7.1% and 6.0% respectively in real terms, higher than the average health spending growth (3.5%) during the pre-pandemic period (2008–09 to 2018–19). During the same period, population growth rates were around 0.5% which was lower than the average population growth rate (1.6%) over the pre-pandemic period.

Figure 2a: Average total health spending per person (a), and annual growth rate, constant prices (b), 2011–12 to 2021–22

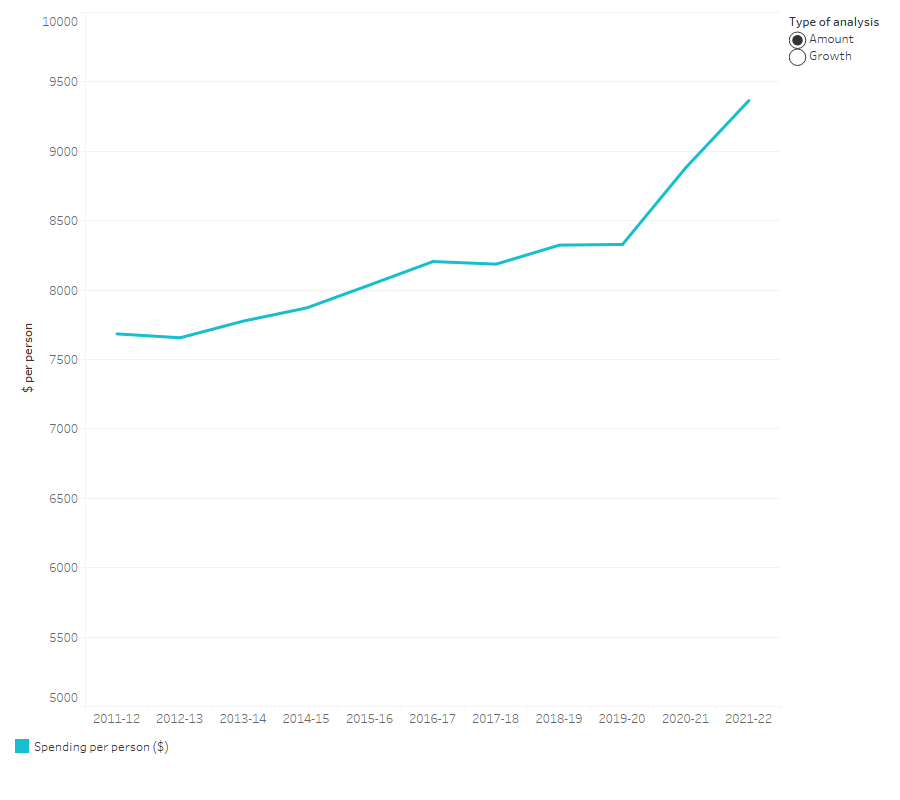
The line graph shows that average total health spending per person in constant prices decreased from $7,684 in 2011–12 to $7,657 in 2012–13. It then increased to $9,365 in 2021–22. Annual growth rate in average total health spending per person ranged from –0.4 per cent and 6.6 per cent between 2011–12 and 2020–21 before decreased to 5.4 per cent in 2021-22. Annual growth rate in 2020–21 was 6.6 per cent, higher than the average annual growth rate in the last 5-year period.  

(a) Based on ABS annual estimated resident population (Table 37).

(b) Constant price health spending is in 2021–22 prices. 

Source: AIHW Health Expenditure Database (Table 3).

Figure 2b: Average total health spending per person, constant prices, during the COVID-19 pandemic (2019–20 to 2021–22) compared with the pre-pandemic period

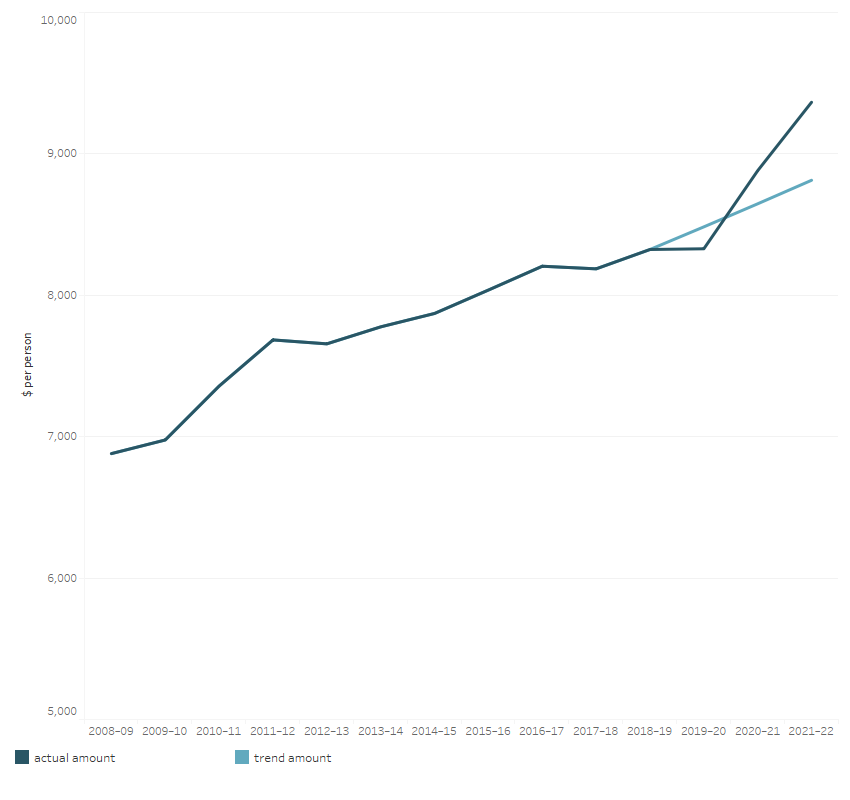
The line graph shows the average total health spending per person, in the three years during the COVID-19 pandemic (2019–20 to 2021–22) compared to the trend of the previous 10-year period (2008–09 to 2018–19). Assuming the average growth rate for the previous 10-year period remains the same from 2019–20 to 2021–22, the trend amounts of average total health spending per person in constant prices from 2019–20 to 2021-22 were $8,484, $8,647, and $8,813 respectively. While the actual amounts for these years were $8,329, $8,881 and $9,365 respectively.

Notes:

  1. Actual amount is the health spending in 2021–22 prices.
  2. Trend amount refers to the heath spending in 2021–22 prices, following the trend of the previous 10-year period (assuming the average annual growth rate for the previous 10-year period remains the same for the period from 2019–20 to 2021–22).
  3. Based on annual estimated resident population (Table 37).

Source: AIHW Health Expenditure Database (Table 3).