The number of times a person uses a health service is influenced by many factors, including patient health needs, the available supply of services and potential barriers such as cost.
Figure 2.3 is an interactive chart where the average number of services per person was calculated for:
- people in the dementia study cohort who used the service at least once (referred to in the figures as “service users”)
- all people in the dementia study cohort, regardless of whether they used the service (referred to in the figures as “cohort”).
The following discussion relates to people who used a service at least once.
People living in the community
People living with dementia in the community in Inner regional areas tended to have similar or slightly lower rates of health service use than people in Major cities, except for specialist attendances, where the average number of attendances was lower.
Of people who used the health service at least once, those living in Remote and very remote areas of Australia had a lower average number of:
- specialist attendances and allied health attendances (total and podiatry)
but a higher average number of:
- emergency department visits and hospital stays
than people living in Major cities.
There was a similar average number of services per person across remoteness areas for:
- GP attendances
- GP chronic disease management attendances
- nursing and/or Aboriginal health worker attendances.
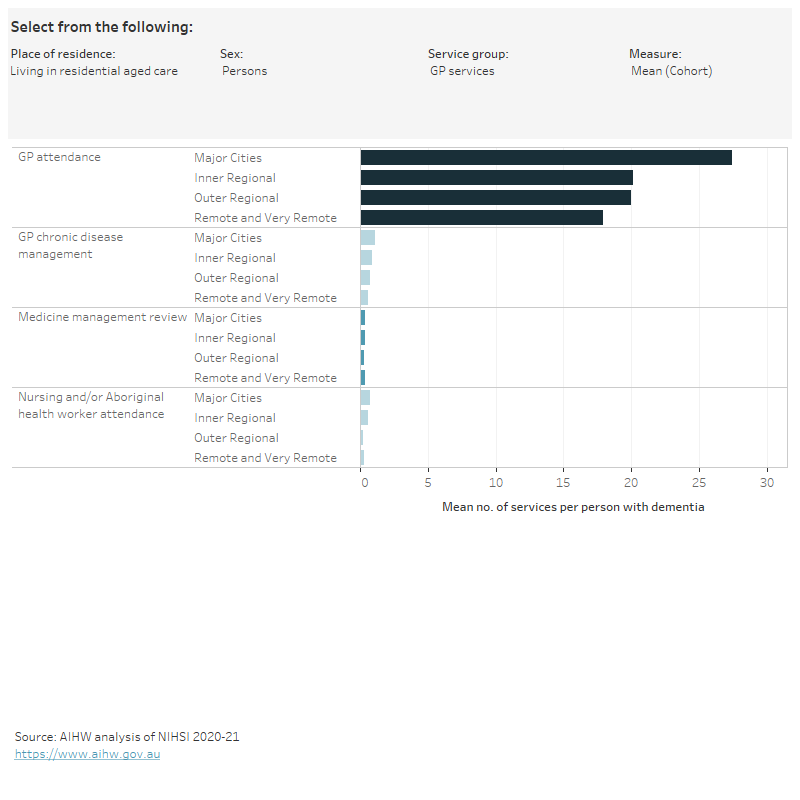
People living in residential aged care
Of people living with dementia in residential aged care who used the health service at least once, those living in Inner regional, Outer regional and Remote and very remote areas of Australia had a lower average number of:
- GP attendances
- specialist attendances
- nursing and/or Aboriginal health worker attendances
than people living in Major cities.
There was a similar average number of services per person across remoteness areas for:
- GP chronic disease management attendances
- allied health attendances
- emergency department visits
- hospital stays.