Hospital care
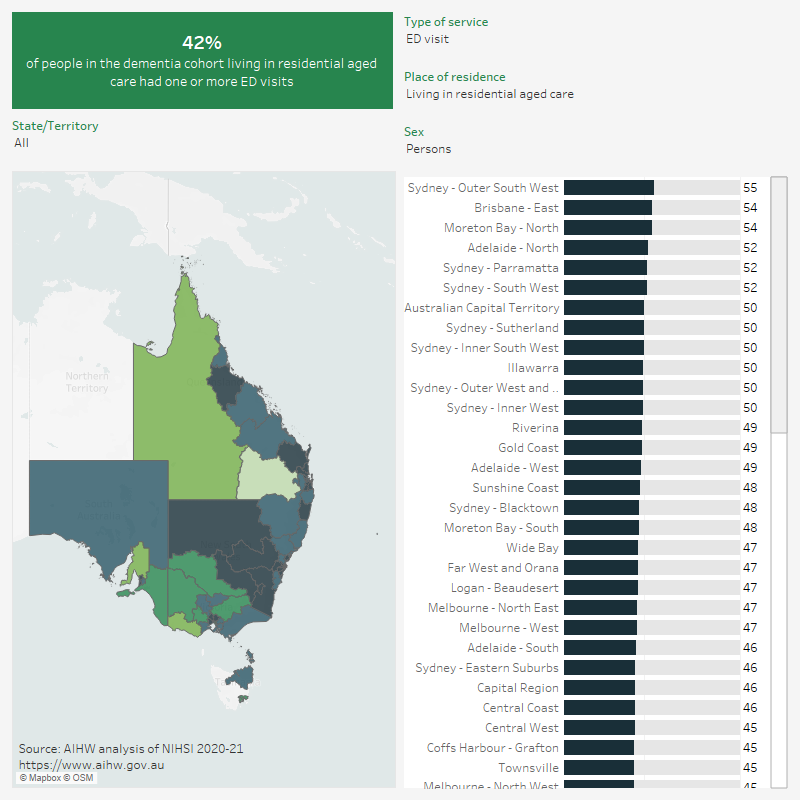
Figure 4.4 is an interactive map and bar chart showing variation in ED visits and hospital stays by SA4 region and sex for people in the dementia study cohort living in the community or living in residential aged care. Data shown are the percentage of people with at least one ED visit or at least one hospital stay. There are 5 colour gradients. SA4s can be selected by state/territory and capital city.