Demographics

Within Major cities, people living in the highest socioeconomic areas were most likely to be identified in the dementia study cohort (Figure 3.1). This is influenced by the higher rates of dispensing of dementia-specific medications to people in these areas.

Outside major cities, people living in the lower socioeconomic areas (quintiles 1 and 2) were most likely to be identified in the dementia study cohort. This is partly because the SEIFA index defines relative advantage and disadvantage in terms of people’s access to material and social resources and their ability to participate in society, so that fewer areas in regional and remote Australia have high IRSD scores (ABS 2018). This should be kept in mind when interpreting the data.

People living with dementia in the highest socioeconomic areas were more likely to be aged over 85 than people living in the lowest socioeconomic areas.

It should be noted that the socioeconomic area of a person’s residential aged care facility may not be the same as the socioeconomic area/s they previously lived in.

Figure 3.1: Number and percentage of people in the dementia study cohort, by place of residence, socioeconomic area (Total, within Major cities and Outside major cities), sex and age group, 2019

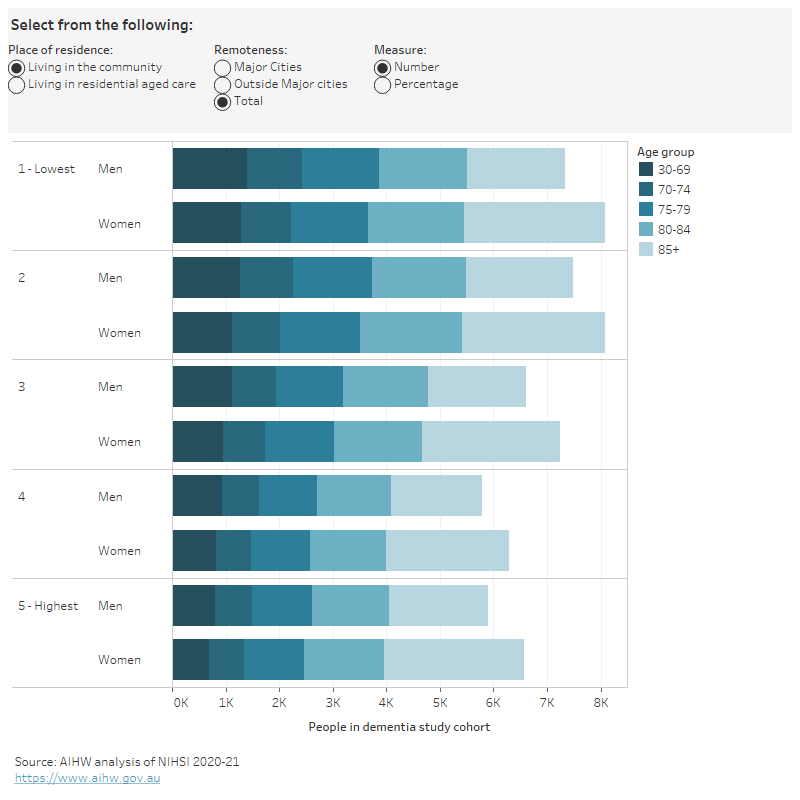
Figure 3.1 is an interactive bar chart showing the number and percentage of people in the dementia study cohort by socioeconomic area (total, within Major cities and Outside major cities), age group and sex. Among people in the dementia study cohort living in Major cities, more people lived in the highest socioeconomic areas (11,800 people in the community and 15,700 in residential aged care) than the lowest socioeconomic areas (8,300 people in the community and 9,300 in residential aged care). Conversely, among people living Outside major cities, more people lived in the lowest socioeconomic areas (7,200 people in the community and 8,900 in residential aged care) than the highest socioeconomic areas (650 people in the community and 850 in residential aged care). People in the highest socioeconomic areas had an older age profile than people in lower socioeconomic areas, and women had an older age profile than men in all socioeconomic areas.

Notes

  1. The dementia study cohort refers to 158,730 people aged 30 and over who were living in Australia in 2019 and had a dementia record in the NIHSI. Western Australia and the Northern Territory were excluded from all analyses because their hospital data were not available for construction of the cohort.
  2. The geographies in this report are based on where a person lived, not where they received services.
  3. Socioeconomic areas are based on 2016 SEIFA IRSD quintiles. People living in the 20% of areas with the greatest overall level of disadvantage are described as living in the lowest socioeconomic areas (quintile 1); people living in the 20% of areas with the least overall level of disadvantage are described as living in the highest socioeconomic areas (quintile 5). 
  4. Remoteness areas are based on the 2016 Remoteness Area Structure within the ASGS. Outside major cities includes Inner regional, Outer regional, Remote and Very remote Australia.
  5. A small number of SA2s with no SEIFA IRSD ranking were excluded from age group analysis because they could not be assigned to a Remoteness Area/IRSD group. As a result, totals for the cohort, remoteness and socioeconomic areas do not sum to the totals for states/territories and SA4 regions.

Data tables: Number and percentage of people in the dementia study cohort

References

ABS (Australian Bureau of Statistics) (2018) Census of Population and Housing: Socio-Economic Indexes for Areas (SEIFA), Australia, 2016, Cat no 2033.0.55.001, Accessed 5 July 2023.