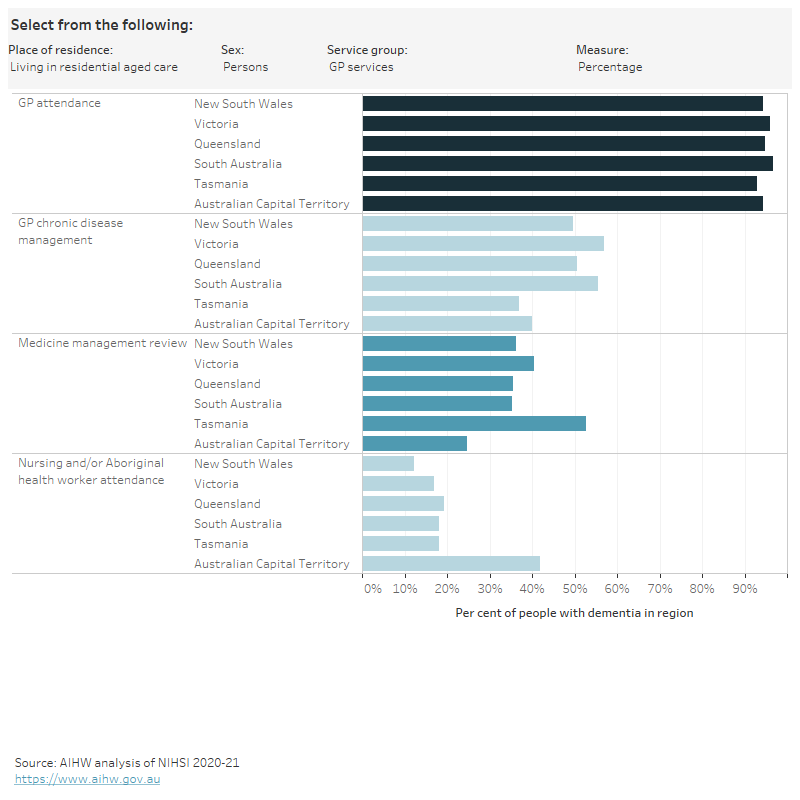
Rates of health service use by state/territory

Figure 5.2 is an interactive chart exploring the use of health services by state/territory, with rates (the percentage of people with at least one service) and age-standardised rates.

Figure 5.2: Health service use among people in the dementia cohort, by place of residence, state/territory of residence and sex, 2019

Figure 5.2 is an interactive bar chart showing variation in the use of a range of health services by state/territory for people in the dementia study cohort living in the community or living in residential aged care. Health services groups shown are GP services, specialist services, allied health services, ED visits, hospital stays, polypharmacy and medications dispensed (1 or more, 4 or more). Measures of use are percentage of people with at least one service and age-standardised rates.

Notes

  1. The dementia study cohort refers to 158,730 people aged 30 and over who were living in Australia in 2019 and had a dementia record in the NIHSI.
  2. The geographies in this report are based on where a person lived, not where they received services. Data are only presented for states/territories with hospital data in the NIHSI.
  3. ‘Percentage’ is the proportion of people in the dementia cohort with at least one service recorded in the NIHSI in 2019.
  4. Age-standardised rates were calculated where population and service counts allowed.
  5. Only public hospital data were included in this analysis: some of the observed variation may be due to the availability and use of private hospitals.
  6. The bar is blank if a value could not be published due to data quality or confidentiality concerns.

Data tables: Health service use among people in the dementia cohort