Rates of health service use by socioeconomic area
Figure 3.2 is an interactive chart exploring the use of health services by socioeconomic area, with rates (the percentage of people with at least one service), rate ratios (where rates for people living with dementia living in the highest socioeconomic areas were used as a reference point to compare with other socioeconomic areas) and age-standardised rates.
Common patterns of variation by socioeconomic area
Overall, people living with dementia in the lowest socioeconomic areas had lower rates of dispensing of dementia-specific medication but higher rates of:
- polypharmacy and hyper-polypharmacy
- emergency department visits and hospital stays
- dispensing of glucose regulating medications and opioids
- dispensing of antipsychotics (in the community)
than people living in the highest socioeconomic areas.
There was a similar rate of service use across socioeconomic areas for:
- GP attendances
- dispensing of antidepressants and benzodiazepines
- medication management review attendances.
Different patterns of variation within and outside Major cities
Access to health services also depends on a person’s circumstance, for example, people living in the lowest socioeconomic areas are more likely to access bulk-billed Medicare services (where the doctor accepts the Medicare rebate as the full payment for the service, and the patient pays nothing) (AIHW 2020), while financial barriers to accessing services can be compounded if a person lives in a rural area with fewer health service providers (Figure 2.2).
People living with dementia in the lowest socioeconomic areas had:
- lower rates of specialist attendances when living in the community in Major cities, but there were similar rates of attendances across socioeconomic areas for people living in residential aged care
- lower rates of specialist attendances Outside major cities both in the community and residential aged care
- higher rates of GP chronic disease management (CDM) and Medicare-subsidised allied health podiatry attendances when living in the community in Major cities (and to a lesser extent in residential aged care)
- lower rates of CDM and Medicare-subsidised allied health optometry attendances in residential aged care Outside major cities, but similar rates in the community
compared with people living in the highest socioeconomic areas.
People living with dementia who had a CDM plan were more likely to have a Medicare-subsidised allied health care attendance than people without a CDM plan, across all socioeconomic areas. For example, among people living in the community in the lowest socioeconomic areas, 81% of those with a CDM plan in 2019 also had an allied health attendance, compared with 38% of those without a CDM plan (Table S2.13).
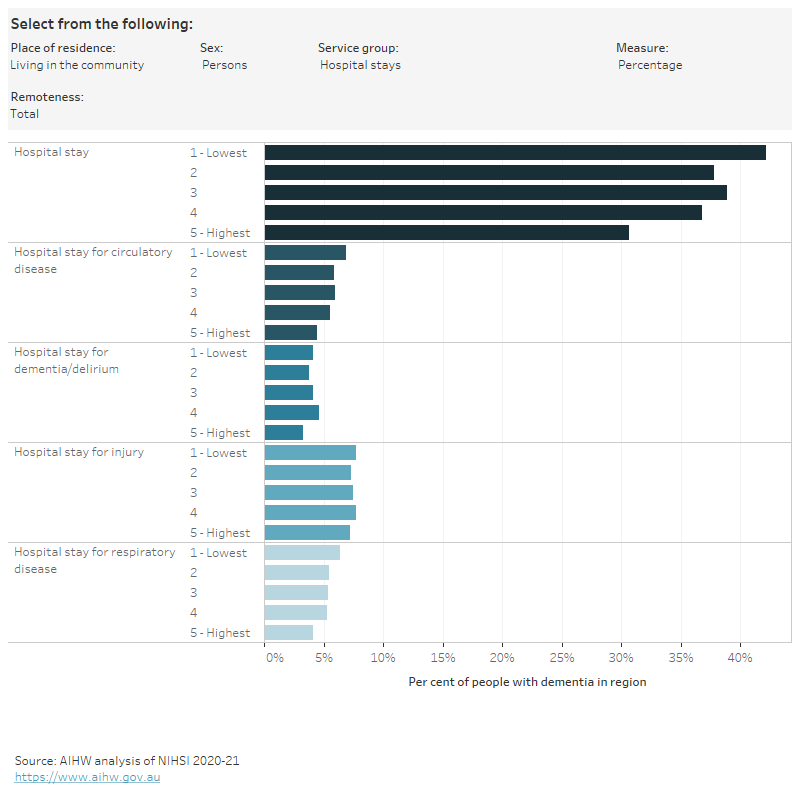
Figure 3.2: Health service use among people in the dementia cohort, by place of residence, socioeconomic area (Total, within Major cities and Outside major cities) and sex, 2019
Figure 3.2 is an interactive bar chart showing variation in the use of a range of health services by socioeconomic area (total, within Major cities and Outside major cities) for people in the dementia study cohort living in the community or living in residential aged care. Health services groups shown are GP services, specialist services, allied health services, ED visits, hospital stays, polypharmacy and medications dispensed (1 or more, 4 or more). Measures of use are percentage of people who used the service, age-standardised rates and rate ratios.
Notes
- The dementia study cohort refers to 158,730 people aged 30 and over who were living in Australia in 2019 and had a dementia record in the NIHSI. Western Australia and the Northern Territory were excluded from all analyses because their hospital data were not available for construction of the cohort.
- The geographies in this report are based on where a person lived, not where they received services.
- ‘Percentage’ is the proportion of people in the dementia cohort with at least one service recorded in the NIHSI in 2019.
- Rate ratios are a method for comparing rates between regions. The rates for people living with dementia living in the highest socioeconomic areas were used as the reference population to compare with other socioeconomic areas (‘Quintile 5 – highest’ for the total cohort, ‘Major cities – quintile 5 – highest’ for analysis within and Outside Major cities). A rate ratio of 1 indicates that the rate for the region is the same as the rate in the reference population. A rate ratio greater than 1 indicates that the rate for the region is higher than the rate in the reference population. A rate ratio less than 1 indicates that the rate for the region is lower than the rate in the reference population.
- Age-standardised rates were calculated where population and service counts allowed.
- Only public hospital data were included in this analysis: some of the observed variation may be due to the availability and use of private hospitals.
- The bar is blank if a value could not be published due to data quality or confidentiality concerns.
Data tables: Health service use among people in the dementia cohort by place of residence, socioeconomic area and sex
References
AIHW (Australian Institute of Health and Welfare) (2020) Coordination of health care: experiences of barriers to accessing health services among patients aged 45 and over, AIHW, Australian Government, accessed 27 June 2023.