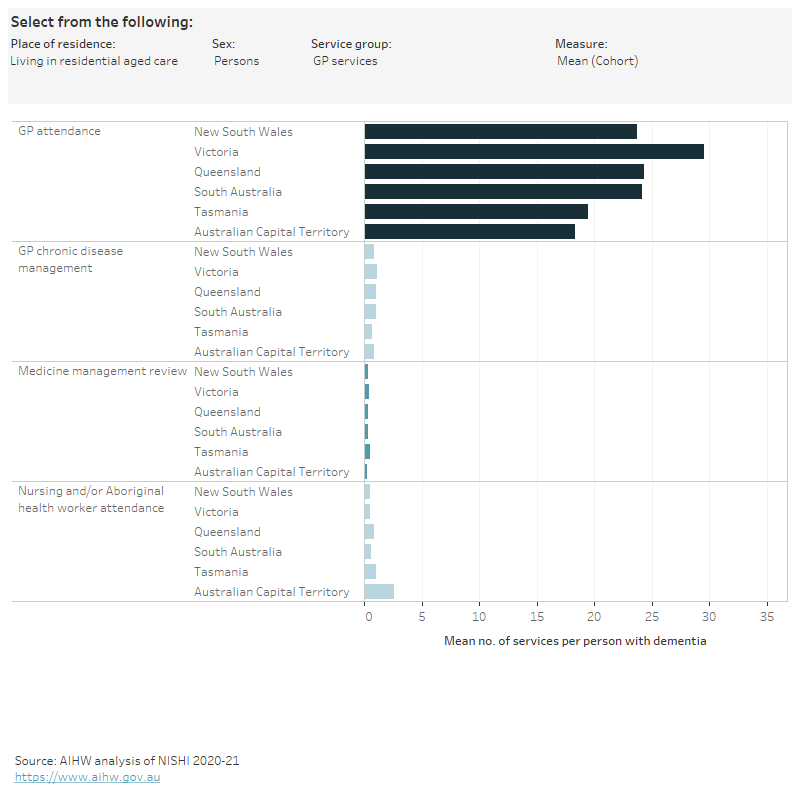
Average number of services per person
Figure 5.3 is an interactive bar chart showing variation in the average number of services per person by state/territory for people in the dementia study cohort living in the community or living in residential aged care. Health services groups shown are GP services, specialist services, allied health services, ED visits and hospital stays. The average number of services were calculated for people who used the service at least once in 2019 and all people in the dementia study cohort, regardless of whether they used the service in 2019 (as an indication of overall access in an area).