Average number of services per person

The number of times a person uses a health service is influenced by many factors, including patient health needs, the available supply of services and potential barriers such as cost.

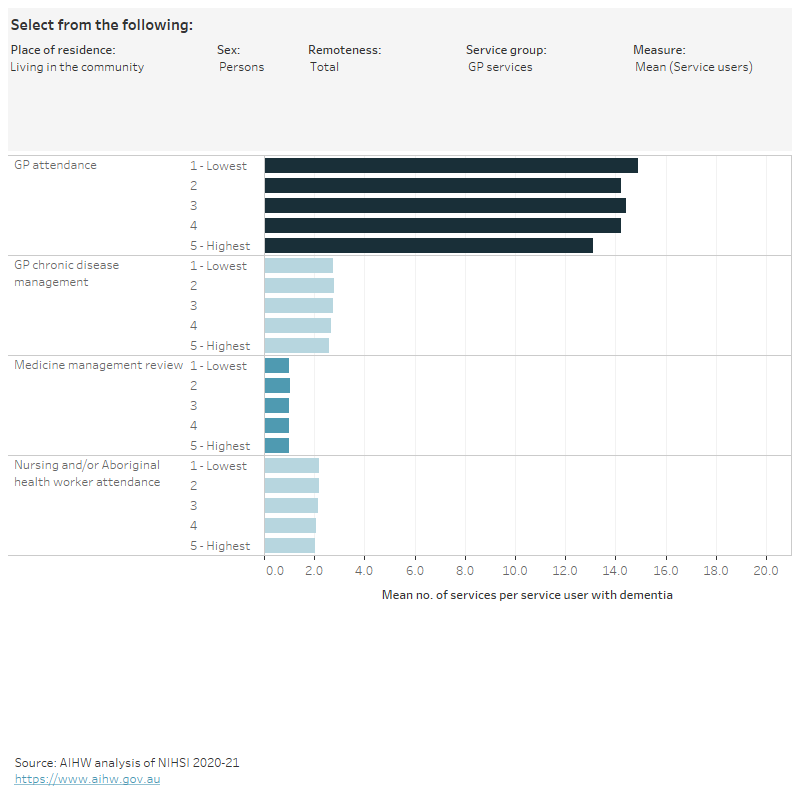
Figure 3.3 is an interactive chart where the average number of services per person was calculated for:

  • people in the dementia study cohort who used the service at least once (referred to in the figures as “service users”)
  • all people in the dementia study cohort, regardless of whether they used the service (referred to in the figures as “cohort”).

The following discussion relates to people who used a service at least once.

Common patterns of variation by socioeconomic area

Of the people living with dementia who used a health service at least once, those living in the community in the lowest socioeconomic areas had a lower average number of specialist attendances than people living in the highest socioeconomic areas, both within and outside Major cities.

People living in residential aged care had a similar average number of specialist attendances across socioeconomic areas, although the average number of attendances Outside major cities was lower than that for Major cities (see also Figure 2.3).

Different patterns of variation within and outside Major cities 

Of the people living with dementia who used a health service at least once, those living in the lowest socioeconomic areas had:

  • a higher average number of GP attendances per person in Major cities, both in the community and in residential aged care
  • a lower average number of GP attendances per person in residential aged care Outside major cities, but a similar average number per person in the community

compared with people living in the highest socioeconomic areas.

Figure 3.3: Average number of services per person, by place of residence, socioeconomic area (Total, within Major cities and Outside major cities) and sex, 2019

Figure 3.3 is an interactive bar chart showing variation in the average number of services per person by socioeconomic area (total, within Major cities and Outside major cities) for people in the dementia study cohort living in the community or living in residential aged care. Health services groups shown are GP services, specialist services, allied health services, ED visits and hospital stays. The average number of services were calculated for people who used the service at least once in 2019 and all people in the dementia study cohort, regardless of whether they used the service in 2019 (as an indication of overall access in an area).

Notes

  1. The dementia study cohort refers to 158,730 people aged 30 and over who were living in Australia in 2019 and had a dementia record in the NIHSI. Western Australia and the Northern Territory were excluded from all analyses because their hospital data were not available for construction of the cohort.
  2. The geographies in this report are based on where a person lived, not where they received services.
  3. “Mean (Service users)” is the mean number of attendances per person for people in the dementia cohort who used the service at least once in 2019.
  4. “Mean (cohort)” is the mean number of attendances per person for all people in the dementia cohort, regardless of whether they used the service in 2019.
  5. Only public hospital data were included in this analysis: some of the observed variation may be due to the availability and use of private hospitals.
  6. The bar is blank if a value could not be published due to data quality or confidentiality concerns.

Data tables: Average number of services per person, by place of residence, socioeconomic area