Demographics

Nearly 2 in 5 (38%) of the dementia study cohort lived in NSW, with 26% living in Victoria, 22% in Queensland, 10% in South Australia, 2.4% in Tasmania and 1.5% in the ACT (Table S5.1). These proportions are similar to the estimated proportions of people living with dementia in each state/territory in 2021 (excluding Western Australia and the Northern Territory) (see How does dementia prevalence vary by geographic area?).

  • The proportion of people aged over 85 living in the community ranged from 28% in Queensland and Tasmania to 33% in NSW, Victoria and South Australia.
  • The proportion of people aged over 85 living in residential aged care ranged from 51% in Queensland and Tasmania to 58% in South Australia.

Figure 5.1: Number and percentage of people in the dementia study cohort, by place of residence, state/territory of residence, sex and age group, 2019

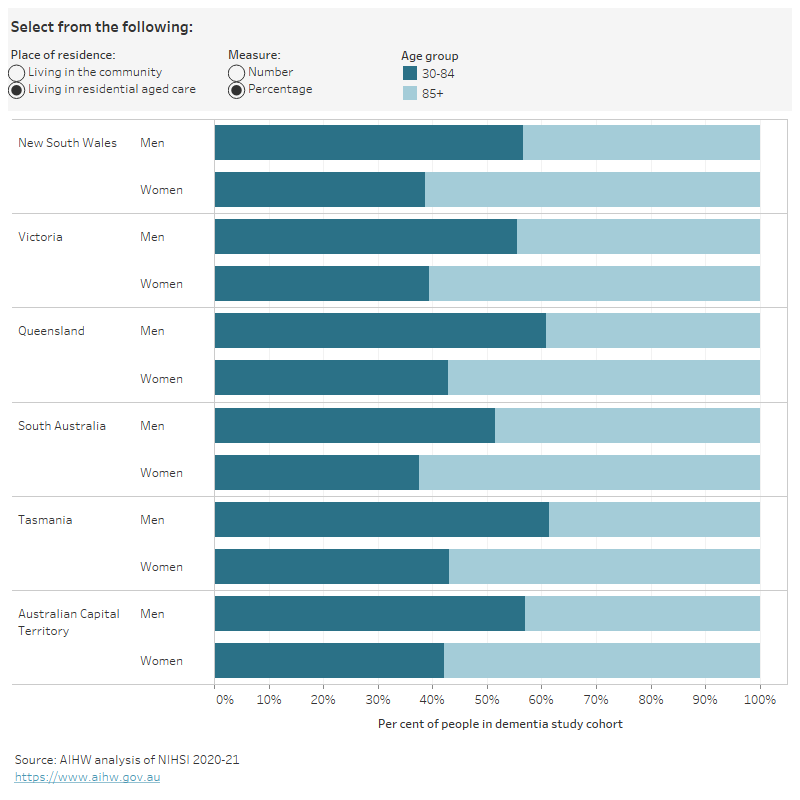
Figure 5.1 is an interactive bar chart showing the number and percentage of people in the dementia study cohort by state/territory, age group and sex. Among people living in the community, most lived in NSW (27,000 people), followed by Victoria (17,400 people), Queensland (15,800 people), South Australia (6,500 people), Tasmania (1,700 people) and the ACT (1,100 people). Among people living in residential aged care, most lived in NSW (33,700 people), followed by Victoria (24,200 people), Queensland (19,100 people), South Australia (8,900 people), Tasmania (2,100 people) and the ACT (1,200 people). Women had an older age profile than men in all states/territories.

Notes

  1. The dementia study cohort refers to 158,730 people aged 30 and over who were living in Australia in 2019 and had a dementia record in the NIHSI.
  2. The geographies in this report are based on where a person lived, not where they received services. Data are only presented for states/territories with hospital data in the NIHSI.  

Data tables: Percentage of people in the dementia cohort