Literacy and numeracy
Data updates
25/02/22 – In the Data section, updated data related to literacy and numeracy are presented in Data tables: Australia’s children 2022 - Education. The web report text was last updated in December 2019.
Key findings
- Between 2008 and 2018, the proportion of Year 5 students who achieved at or above the national minimum standard for reading and numeracy increased.
- Reading increased 4 percentage points from 91% to 95%.
- Numeracy increased 3 percentage points from 93% in to 96%.
Literacy and numeracy are fundamental building blocks for children’s educational achievement, their lives outside school and engagement with society, and their future employment prospects.
Literacy and numeracy skills have been positively associated with educational attainment in adulthood (Shuey & Kankaras 2018). Weak literacy and numeracy skills can lead to disadvantage in terms of limited access to desirable employment opportunities or unemployment (OECD 2017). Australia’s performance in the 2011–12 Survey of Adult Skills was average to very good; however, 1 in 5 Australians had low literacy and/or numeracy skills, with numeracy a particular challenge (OECD 2017).
Literacy and numeracy and knowledge of key disciplines are the cornerstone of schooling for young Australians (MCEETYA 2008). They are 2 of the 7 general capabilities included in the Foundation to Year 10 Australian Curriculum (ACARA 2019a).
Literacy involves ‘students listening to, reading, viewing, speaking, writing and creating oral, print, visual and digital texts, and using and modifying language for different purposes in a range of contexts’ (ACARA 2019a).
Numeracy encompasses ‘the knowledge, skills, behaviours and dispositions that students need to use mathematics in a wide range of situations’ (ACARA 2019a).
While literacy and numeracy skills are explicit in English and Mathematics, all Australian Curriculum learning areas require discipline-specific literacy and numeracy knowledge and skills (ACARA 2017). The growth of new technologies and new industries has led to an increasing need for science, technology, engineering and mathematics (STEM) expertise in the workforce. Mathematical thinking is a fundamental skill that underpins all STEM learning (Education Council 2015).
A number of factors affect successful educational outcomes during the school years, including a child’s home environment, such as if books are available at home and if parents read aloud to their children. Children whose parents read to them every day at 2–3 year olds had on average higher Year 3 NAPLAN reading scores, than children whose parents read to them less frequently (Yu & Daraganova 2015) (see Early learning). Attending preschool programs has also been found to be positively associated with year-3 NAPLAN results (Warren & Haisken-DeNew 2013) (see Early learning). School factors that affect outcomes can include:
- quality of schooling
- availability of interventions and support
- student commitment
- proximity of the school and other educational facilities to students’ homes (ACARA 2015).
Closing the gap in literacy and numeracy national minimum standard achievement rates between Indigenous and non-Indigenous children was a key priority of the Closing the Gap framework established by the Council of Australian Governments (COAG) in 2018. In 2018, 77.2% of Indigenous Year 5 students achieved the national minimum standard for reading, and 81.4% for numeracy (ACARA 2018).
Although the target was not met, for Year 5 there were substantial improvements with the gap narrowing in reading and numeracy. Targets for the Closing the Gap Refresh agenda are not yet finalised (PM&C 2019).
Box 1: Data sources on literacy and numeracy
Australia’s National Assessment Program has several components (see Child learning and development). The components discussed in this section are the:
- National Assessment Program – Literacy and Numeracy (NAPLAN)
- national sample assessments of civics and citizenship information, communication technology literacy, and science literacy
- international assessments, Progress in International Reading Literacy Study (PIRLS), Trends in International Mathematics and Science Study (TIMSS) and Programme for International Student Assessment.
National Assessment Program – Literacy and Numeracy
NAPLAN tests have been conducted annually for all students across Australia in years 3, 5, 7 and 9 since 2008. They give nationally comparable data. National minimum standards have been developed for reading, writing, spelling, language conventions (grammar and punctuation) and numeracy.
Data in this section are expressed in terms of the percentage of students who achieved at or above the national minimum standard (sometimes abbreviated in this section as the achievement rate). This is in line with national reporting for the Children’s Headline Indicators. However, the indicator has limitations as more than 90% of students usually meet this and the standard can change.
In 2006, the 19 priority areas of the Children’s Headline Indicators were endorsed by 3 ministerial councils, 1 focusing on health, 1 on education, and 1 on community and disability services. There is scope for a comprehensive review of these areas and the indicators to ensure they reflect contemporary information needs.
The focus in this section is on Year 5 students in line with indicator reporting for Children’s Headline Indicators.
By Year 5, students have had an opportunity to build on the outcomes achieved in Year 3 and are able to demonstrate progress across several years of schooling. The national minimum standard is the agreed minimum acceptable standard of knowledge and skills without which a student will have difficulty making sufficient progress at school (ACARA 2018).
In 2018, NAPLAN participation rates for Year 5 students were 95.3% for reading and 94.8% for numeracy (ACARA 2018).
Progress in International Reading Literacy Study
PIRLS is an international comparative study of the reading literacy of students at Year 4, directed by the International Association for the Evaluation of Educational Achievement. The study has been conducted on a 5-year cycle since 2001. Australia has participated in the 2 most recent cycles—PIRLS 2011 and 2016 (Thomson et al. 2017a). Australia will also be participating in 2021.
In 2016, more than 580,000 Year 4 students in 50 countries from around the world took part. In Australia, 6,341 Year 4 students from 286 primary schools participated (Thomson et al. 2017a).
Trends in International Mathematics and Science Study
The TIMSS is an international comparative study of student achievement in maths and science at Year 4 and Year 8 directed by the International Association for the Evaluation of Educational Achievement. The study has been conducted on a 4-year cycle since 1995. Australia has participated since inception.
In 2015, more than 580,000 Year 4 and Year 8 students in 57 countries from around the world took part. In Australia, 6,057 Year 4 students from 287 primary schools participated and 10,338 Year 8 students from 285 secondary schools participated (Thomson et al. 2017b).
How many students achieve at or above the minimum standards for reading and numeracy?
In 2018, most Year 5 students achieved at or above the minimum standards for reading (95%) and numeracy (96%) (Figure 1). A higher proportion of girls (96%) than boys (94%) achieved at or above the minimum standard for reading. Similarly, a higher proportion of girls (96%) than boys (95%) in Year 5 achieved at or above the minimum standard for numeracy.
Most Year 3 (96%) and Year 7 (94%) students also achieved at or above the reading minimum standards. Similarly, 96% of both Year 3 and 7 students achieved at or above the numeracy minimum standards.
Girls were more likely to achieve at or above reading and numeracy standards for both years 3 and 7 (Figure 1).
Figure 1: Students achieving at or above the national minimum standards for reading and numeracy, years 3, 5 and 7, 2018 (%)
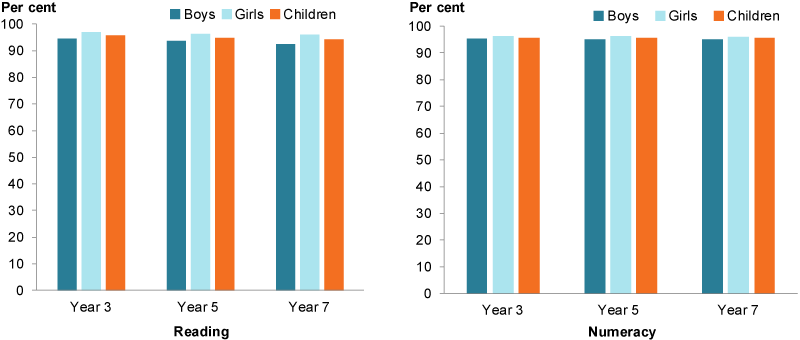
Chart: AIHW. Source: ACARA 2018.
Have literacy and numeracy rates changed over time?
Between 2008 and 2018, the proportion of Year 5 students who achieved at or above the national minimum standard for reading increased 4 percentage points (91% to 95%). This pattern was the same for boys and girls (Figure 2). The reading mean score for Year 5 students also increased significantly from 484.4 to 509.3:
- for boys it increased significantly from 478.4 to 505.1
- for girls it increased from 490.7 to 513.7 (ACARA 2018).
Similarly, the proportion of Year 5 students who achieved at or above the national minimum standard for numeracy increased from 93% in 2008 to 96% in 2018. The pattern was the same for boys and girls (Figure 2). The numeracy mean score for Year 5 students also increased significantly from 475.9 to 494.0:
- for boys it increased significantly from 481.6 to 498.7
- for girls it increased from 469.9 to 489.2 (ACARA 2018)
Over the same period, there was improvement in Year 3 reading achievement, but no change in numeracy achievement. There was no overall change for Year 7 students in reading or numeracy (ACARA 2018).
Box 2: Preliminary NAPLAN 2019 results
National 2019 preliminary results for Year 5 reading released in August 2019 indicate that 94.9% of students achieved at or above the national minimum standard. These results are the same as the 2018 final results.
For Year 5 numeracy, the national 2019 preliminary results showed almost no change from the 2018 final results (95.6% and 95.7%, respectively) (ACARA 2019b).
Figure 2: Students achieving at or above the national minimum standards for reading and numeracy, 2008 to 2018 (%)
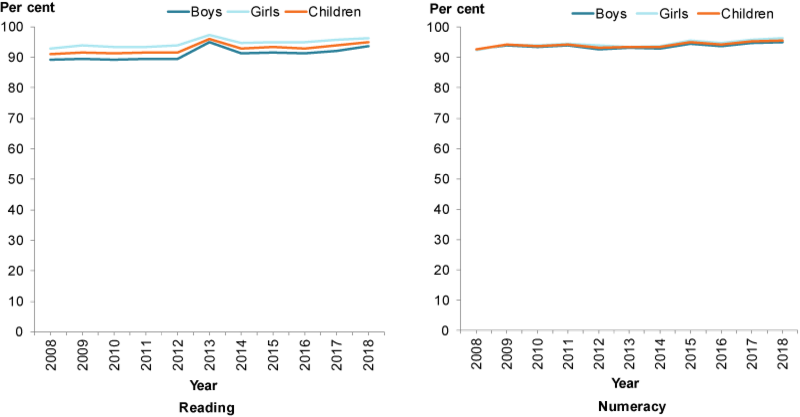
Chart: AIHW. Source: ACARA 2018.
Are literacy and numeracy rates the same for everyone?
In 2018, Year 5 students from schools in Remote (85%) and Very remote (54%) areas were less likely to achieve at or above the reading minimum standards than those from schools in Major cities (96%) (Figure 3). For numeracy, the corresponding proportions were 89% and 61%, compared with 96% (Figure 4).
Year 5 students with a language background other than English (LBOTE) were slightly less likely to achieve at or above the minimum standards in reading (93%) and numeracy (95%) than their non-LBOTE counterparts in 2018 (96% and 96%, respectively).
There were differences in achievement rates between Year 5 Indigenous and non-Indigenous students for reading (77% and 96%, respectively). The gap was slightly narrower for numeracy (81% and 97%, respectively).
Figure 3: Year 5 students achieving at or above the national minimum standards for reading, by selected population groups, 2018
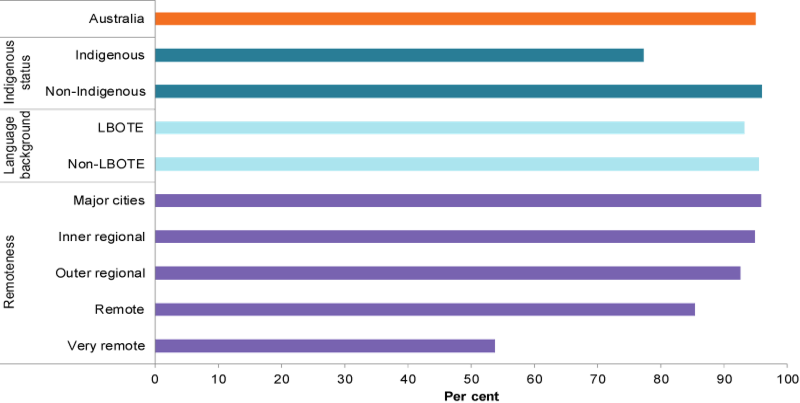
Chart: AIHW. Source: ACARA 2018.
Figure 4: Year 5 students achieving at or above the national minimum standards for numeracy, by selected population groups, 2018
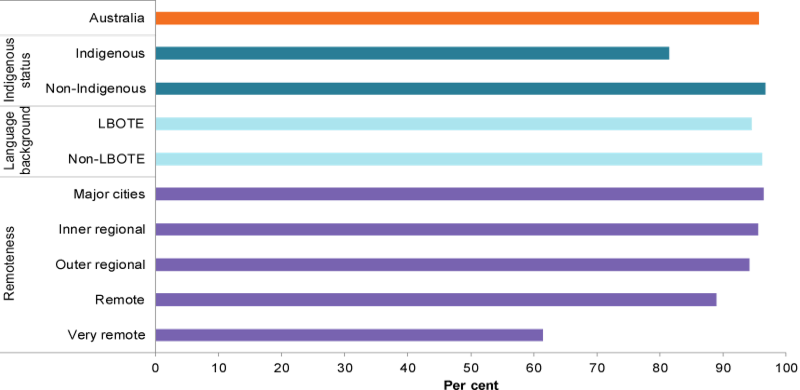
Chart: AIHW. Source: ACARA 2018.
Closing the Gap targets in literacy and numeracy
For Year 5 students, the COAG target to halve the gap in the proportion of Indigenous children at or above national minimum standards in reading and numeracy within a decade (by 2018) was not achieved. However, there have been substantial improvements with the gap narrowing. The proportion of Year 5 students at or above national minimum standards in reading increased by around 14 percentage points (63% in 2008 to 77% in 2018). For numeracy the increase was around 12 percentage points (69% in 2008 to 81% in 2018).
In 2018, the difference between Indigenous and non-Indigenous students increased with increasing remoteness:
- for reading, from 11 percentage points in Major cities (85% for Indigenous students compared with 96% for non-Indigenous students) to 58 percentage points in Very remote areas (93% compared with 36%)
- for numeracy, from 9 percentage points in Major cities (88% compared with 97%) to 49 percentage points in Very remote areas (46% compared with 96%) (Figure 5).
Figure 5: Year 5 students achieving at or above the national minimum standards for reading and numeracy, by Indigenous status, by remoteness, 2018
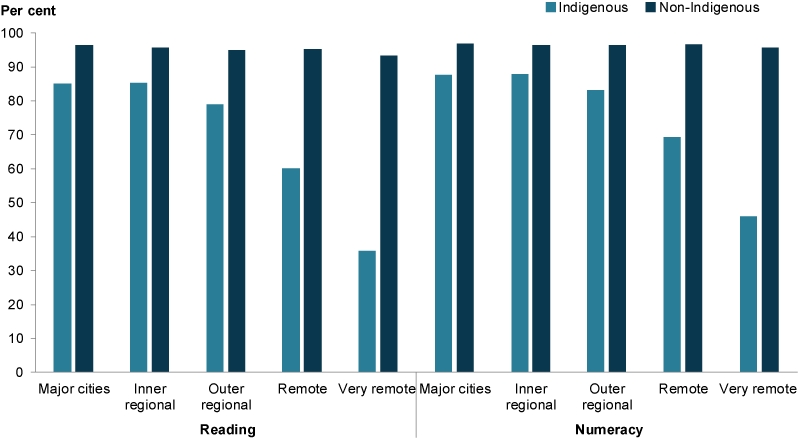
Chart: AIHW. Source: ACARA 2018.
Parental education and occupation
Most (98%) Year 5 students whose parents hold a bachelor’s degree or higher achieved at or above the national minimum standard for reading. At least 93% of students whose parents completed Year 12 or higher achieved at or above the national minimum standard in reading compared to 83% of students whose parents had not completed Year 12 (Figure 6).
Figure 6: Year 5 students achieving at or above the national minimum standards for reading, by parental education, 2018
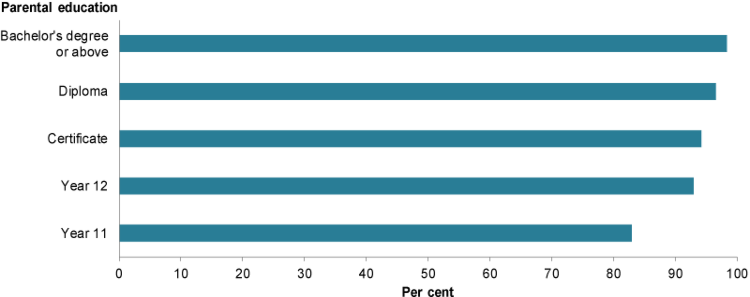
Chart: AIHW. Source: ACARA 2018.
Similar to reading, most (99%) Year 5 students whose parents hold a bachelor’s degree or higher achieved at or above the national minimum standard for numeracy (99%). At least 94% of students whose parents completed Year 12 or higher achieved at or above the national minimum standard in reading compared to 86% of students whose parents had not completed Year 12 (Figure 7).
Figure 7: Year 5 students achieving at or above the national minimum standards for numeracy, by parental education, 2018
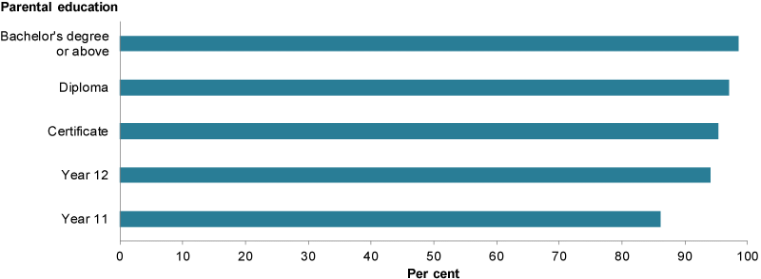
Chart: AIHW. Source: ACARA 2018.
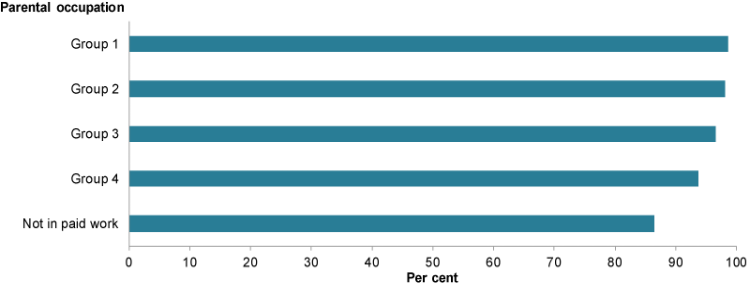
The percentage of students who scored at or above the national minimum standard for reading or numeracy is also associated with parental occupation. Year 5 students with parents in Occupation Group 1 (which includes senior managers and qualified professionals) have the highest percentage of students who achieved at or above the national minimum standard for reading (99%). At least 92% of students whose parents were in paid work achieved at or above the national minimum standard in reading compared to 84% of students whose parents were not in paid work (Figure 8).
Figure 8: Year 5 students achieving at or above the national minimum standards for reading, by parental occupation, 2018
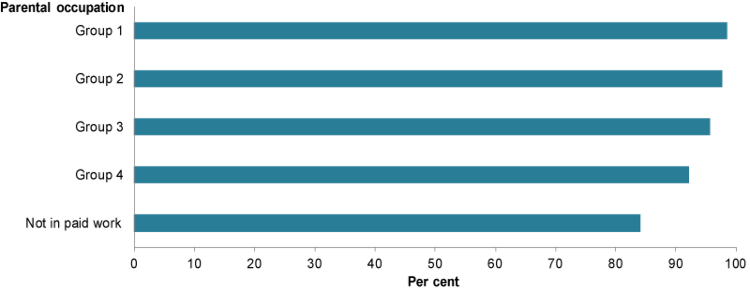
Note: Group 1: Senior management and qualified professionals; Group 2: Other business managers and associated professionals; Group 3: Tradespeople, clerks, skilled office, sales and service staff; Group 4: Machine operators, hospitality staff, assistants, labourers; Not in paid work: Not in paid work in the previous 12 months.
Chart: AIHW. Source: ACARA 2018.
Year 5 students with parents in Occupation Group 1 have the highest percentage of students who achieved at or above the national minimum standard for numeracy (99%). At least 94% of students whose parents were in paid work achieved at or above the national minimum standard in numeracy compared to 87% of students whose parents were not in paid work (Figure 9).
Figure 9: Year 5 students achieving at or above the national minimum standards for numeracy, by parental occupation, 2018
Note: Group 1: Senior management and qualified professionals; Group 2: Other business managers and associated professionals; Group 3: Tradespeople, clerks, skilled office, sales and service staff; Group 4: Machine operators, hospitality staff, assistants, labourers; Not in paid work: Not in paid work in the previous 12 months.
Chart: AIHW. Source: ACARA 2018.
Children in care
Findings from data linkage of the Child Protection National Minimum Data Set with NAPLAN results found that in 2013, children in care were less likely to achieve at or above national minimum standards for literacy and numeracy than all students in Australia (Box 2 defines in care).
In 2013, 83% of Year 5 children in care achieved at or above the national minimum standard for literacy; 13 percentage points lower than the national rate (96%). For numeracy, the rate for children in care was 71%; 22 percentage points lower than the national numeracy rate (93%) (AIHW 2015). National minimum standard achievement rates for most domains generally decreased as year level increased from Year 3 to Year 9 (AIHW 2015).
It is important to note that the academic outcomes for children in care are likely affected by complex personal histories and multiple aspects of disadvantage (including poverty, maltreatment, family dysfunction and instability in care and schooling) (AIHW 2015). There is also evidence that children often have low educational performance when entering child protection services (AIHW 2015).
Box 2: Defining children in care
Children in care—for project which linked child protection data with NAPLAN data—is defined as children aged 0–17 whose care arrangements have been ordered through the Children’s Court, where parental responsibility for the child or young person has been transferred to the Minister/Chief Executive. Most children in care are also out-of-home care, but some are not.
Data are included for children from 6 jurisdictions (NSW, Vic, WA, Tas, ACT and NT).
The child population described in this section participated in 2013 NAPLAN testing for years 3, 5, 7 or 9 and were in care at the time of testing (14–16 May 2013) (AIHW 2015).
At the time of testing, around one-third of the study population had been in their current care situation (order or living arrangement) for less than 1 year.
Children with mental health issues
Average NAPLAN test scores for student with mental disorders were lower compared with those with no mental disorder across all domains (Grammar, Reading, Spelling, Writing, and Numeracy), and all year groups (3, 5, 7, and 9) (Goodsell et al. 2017). These findings are based on data from the 2013–14 Second Australian Child and Adolescent Survey of Mental Health and Wellbeing (Young Minds Matter) and participating children’s NAPLAN results from 2008–2016.
The proportions of students who perform at or above the national minimum standard were also lower for those with a mental disorder than for those without a mental disorder (Goodsell et al. 2017).
How does Australia compare internationally?
Literacy
In 2016, on average, Australian students performed better in the international PIRLS assessment for literacy, than students in 24 countries, including 3 other countries that tested in English: New Zealand, Trinidad and Tobago, and Malta. However, Australian students were outperformed by students in 13 countries, including Singapore, Hong Kong, Ireland, Northern Ireland and England (all testing in English), as well as the Russian Federation, Finland and Poland. The top performing countries were Singapore, Russian Federation and Hong Kong (Thomson et al. 2017a).
Of the participating Australian students, 16% performed very well (reached the Advanced international benchmark). This compares with:
- 29% of students in Singapore
- 26% in the Russian Federation
- 22% in Northern Ireland (Thomson et al. 2017a).
The average score for Australian students on PIRLS 2016 was 17 points higher than in PIRLS 2011, a statistically significant difference (Thomson et al. 2017a).
Numeracy
In 2016, Australia’s average score on TIMSS for Year 4 students was 517 points. Australian students significantly outperformed students in 20 other countries, including Italy, Spain and New Zealand. However, Australian Year 4 students were outperformed by students in 21 other countries, including Northern Ireland, Ireland, England and the United States, as well as the participating East Asian countries Singapore, Hong Kong, Korea, Chinese Taipei and Japan (Thomson et al. 2017b).
Australia’s 2015 Year 4 mathematics score is significantly higher than the corresponding score in 1995. This, however, is due to a single increase recorded in TIMSS 2007 with no change in the following years. For the past 3 cycles, Australia’s Year 4 mathematics scores have remained the same (Thomson et al. 2017b).
Of the participating Australian students, 9% performed very well (achieved the Advanced international benchmark in mathematics), compared with 50% of students in Singapore and 27% in Northern Ireland.
Students who have many books in the home were found to score 19 score points higher than students with an average number of books in the home, and 74 score points higher than those who reported having a few books in the home (Thomson et al. 2017b).
Data limitations and development opportunities
Linkage of national data to improve understanding of children’s educational outcomes, pathways and transitions, especially for priority populations, will give opportunities to enhance national reporting in the future.
For more information, see ‘What’s missing?’ in Child learning and development.
Where do I find more information?
For information on:
- NAPLAN results for Indigenous children, see: Indigenous children
- NAPLAN results, see: Literacy and Numeracy in Children’s Headline Indicators
- NAPLAN, see: NAPLAN national reports and Child and adolescent mental health and educational outcomes report.
- international literacy and numeracy results, see: Progress in International Literacy Study (PIRLS) and Trends in International Mathematics and Science Study (TIMSS)
See also Methods.