Children and crime
Data updates
25/02/22 – In the Data section, updated data related to children and crime are presented in Data tables: Australia’s children 2022 – Justice and safety. The web report text was last updated in December 2019.
Key findings
- In 2018, there were around 7,900 sexual assaults against children aged 0–14. The rate of sexual assault was 3.5 times higher for girls than boys (266 sexual assaults per 100,000 girls, compared with 72 sexual assaults per 100,000 boys).
- In 2016–17, parents, carers and other family members were identified as the perpetrators for almost half (48%) of all assault-related hospitalisations for children aged 0–14.
- In 2012–14, there were 35 deaths due to homicide among children aged 0–14, a rate of 0.4 per 100,000 children—this increased to 2.3 per 100,000 for infants under the age of 1.
- In 2017–18, more than two-thirds (around 68% or 9,400) of the 13,800 criminal offences committed by children aged 10–14 were committed by boys.
Children can be exposed to crime as victims or witnesses within their home or the broader community. In a small number of cases, children may also be offenders. Any type of exposure to crime at a young age can have potentially detrimental impacts on a child’s health, safety and development (ANROWS 2018; WHO 2016). The types of crime children can be exposed to vary from non-violent crime, such as theft or fraud, to highly violent crime, such as aggravated sexual assault or homicide (ABS 2011a).
There can be physical and/or emotional impacts for children who are victims of, or who witness crime. In some cases, these may be short-term, such as a broken bone, temporary guilt, or behaviour regression; however, in many cases, the consequences can involve much longer-term developmental, mental, physical and social problems (ANROWS 2018; Finkelhor et al. 2009; Lewis et al. 2010; WHO 2016). For example, children exposed to crime, especially violent crime or crime involving weapons, may have:
- increased likelihood of depression
- suicidal ideation and behaviour
- psychopathology and other psychological disorders
- future victimisation and offending
- homelessness (AIHW 2018; Bland & Shallcross 2015; Campo 2015; Holt et al. 2008; Jaffe et al. 2012; Knight 2015; Lewis et al. 2010; Mitchell et al. 2015).
Children who are themselves offenders are more likely to have diminished educational attainment and social participation, interpersonal difficulties and are at higher risk of future offending (Aizer & Doyle 2015; Gann et al. 2015; Hagell & Jeyarajah-Dent 2006).
Research indicates that the negative impacts resulting from a child’s direct exposure to crime are cumulative, with negative impacts increasing with the number and types of exposures (Finkelhor et al. 2007a, 2007b; Mitchell et al. 2015). While the greatest negative impacts on children tend to result from exposure to violent interpersonal crimes, property related crime can also have an impact, for example burglary and fraud have been found to have long lasting emotional and relational impacts on children (Dinisman & Moros 2017).
Some, but not all, crimes are identified when police become involved or a hospitalisation occurs as a direct result of the crime (ABS 2011a). This chapter focuses predominately on children who are victims of crime using Australian Bureau of Statistics (ABS) 2017 Recorded Crime data (Box 1). Some data on recorded crimes perpetrated by children are also provided. As not all incidents of crime are reported to police, recorded crimes data are likely to underestimate the true rate of crime involving children.
Children who are victims of assault may receive medical attention and/or support in various ways, for example, through a general practitioner, pharmacist, teacher, or emergency department. Data on assaults resulting in hospitalisation are included as 1 example of related health service use.
Box 1: Data sources
Data on crimes committed against or by children are drawn from the 2018 Recorded Crime—Victims and 2017–18 Recorded Crime—Offenders statistics published by the Australian Bureau of Statistics (ABS). Crimes are reported to police in each state and territory and published according to the National Crime Recording Standard categories.
ABS Recorded Crime data include offences classified to selected divisions and/or subdivisions of the Australian and New Zealand Standard Offence Classification (ANZSOC).
Recorded Crime data reflect unique offences, not unique people.
For victims’ data, only 1 offence is counted for a single incident unless there are multiple offences within the incident that fall under different ANZSOC offence categories. Incidents that include multiple offences within the same offence category are counted only once.
For offenders’ data, only the principal offence within an incident is counted. It should be noted that alleged offences may be later withdrawn or not be substantiated, and not all incidents of crime are reported to the police.
Selected offences are defined as being related to family and domestic violence where the relationship of offender to victim, as stored on police recording systems, falls within a specified family or domestic relationship, or where a family domestic violence flag has been recorded, following a police investigation.
Data in this chapter on assault resulting in hospitalisation are from the AIHW National Hospital Morbidity Database and include hospitalised assault injuries where the episode of admitted patient care ended during the financial year (1 July 2016 to 30 June 2017). Hospital morbidity data reflect unique hospitalisations, not unique people. These data represent a subset of children receiving care for assault, as some children may access other services, for example emergency department care and/or care from general practitioners. In addition, some children may not need or be able to seek help.
Data in this chapter on homicide are sourced from the AIHW National Mortality Database.
Often children who are assaulted, sexually or otherwise, may have contact with state and territory child protection systems (see Child abuse and neglect and Children in non-parental care) and there would be some overlap in recorded crime and child protection data presented in this report. When assault is perpetrated by a family member it is consider family violence (see Children exposed to family violence). Extreme cases of bullying may also be considered assault (see Bullying).
How many children are victims of crime?
According to the ABS 2018 Recorded Crime statistics, there were around 9,300 sexual assault, kidnapping/abduction, robbery and blackmail/extortion offences against children aged 0–14. Sexual assault accounted for the large majority of these (85% or around 7,900 cases). There was also around 8,600 other assault offences, such as grievous bodily harm, torture, and use of a weapon, perpetrated against children aged 0–14 in the 6 jurisdictions for which data were available—New South Wales, South Australia, Western Australia, Tasmania, Northern Territory and the Australian Capital Territory (ABS 2019a).
Recorded crime data for 2018 assaults resulting in death (homicide) were not separately available for children aged 0–14; however, 2012–14 data on homicides involving children are presented in a subsequent section.
As sexual assault and other assault (Box 2) account for the large majority of recorded crimes against children aged 0–14, they will be the main focus here.
Box 2: Defining and measuring assault
Sexual assault refers to any physical contact, or intent of contact, of a sexual nature directed toward another person where that person does not give consent, gives consent as a result of intimidation or deception, or consent is unable to be given because of youth, temporary/permanent (mental) incapacity or familial relationship (ABS 2019a). Includes aggravated sexual assault and non-aggravated sexual assault (ABS 2011b).
Other assault refers to the direct infliction or threat of force, injury or violence where there is an apprehension that the threat could be enacted (ABS 2019a). Includes serious assault resulting in injury, serious assault not resulting in injury and common assault (ABS 2011b).
How many children experience assault?
Sexual assault
According to ABS Recorded Crime—Victims data, around 7,900 sexual assaults were perpetrated against children aged 0–14 in 2018. This equates to a rate of 167 sexual assaults per 100,000 children (Figure 1). Around two-fifths (3,100) of these were considered to be related to family violence, and these data are explored further in Children exposed to family violence.
In 2018, sexual assault was:
- 4 times as likely to be perpetrated against older children aged 10–14 than younger children (338 sexual assaults per 100,000 children compared with 86 sexual assaults per 100,000)
- more than 3.5 times as likely to be perpetrated against girls than boys (266 sexual assaults per 100,000 girls, compared with 72 sexual assaults per 100,000 boys).
Figure 1: Victims of sexual assault by age and sex, 2018
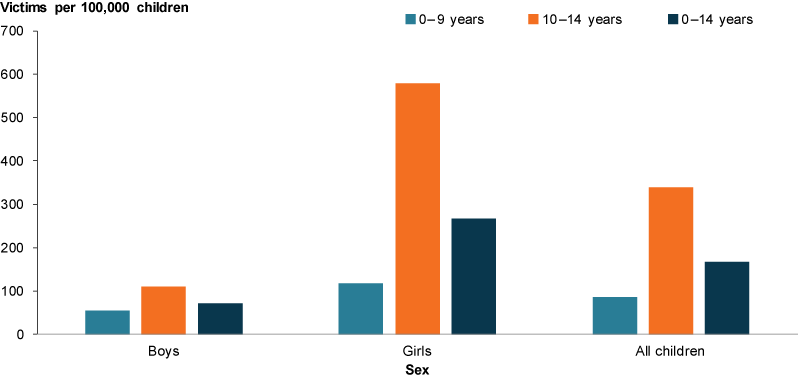
Chart: AIHW. Source: ABS 2019a.
Other assault
Other assault rates for children aged 0–14 in 2018 varied between states and territories. The highest rate was 492 assaults per 100,000 children in the Northern Territory and the lowest rate was 160 assaults per 100,000 children in Tasmania (Figure 2) (ABS 2019c).
For all states and territories presented, other assault was perpetrated against children aged 10–14 at a much higher rate than younger children. The discrepancy was greatest in Tasmania, where other assault was perpetrated against children aged 10–14 at a rate 8 times that for children aged 0–9 (377 assaults per 100,000 compared with 47) (ABS 2019c).
Figure 2: Victims of other assault by age and selected state and territory, 2018
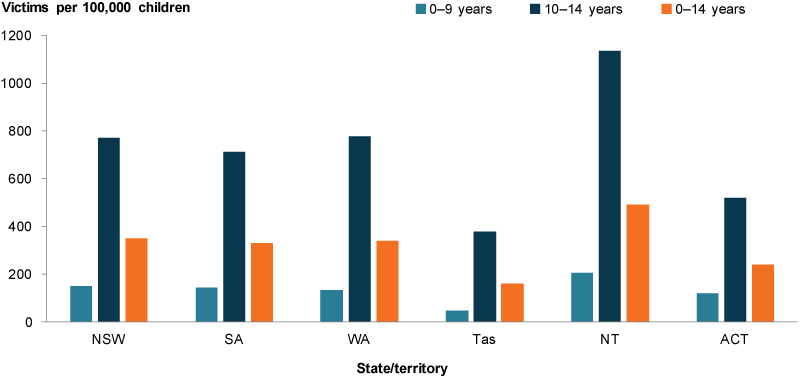
Chart: AIHW. Source: ABS 2019c.
Except for the Northern Territory, other assault was perpetrated against boys at higher rates than girls (Figure 3). Girls in the Northern Territory had the highest rate overall, at 628 assaults per 100,000 children (ABS 2019c).
Figure 3: Victims of other assault by sex and selected state and territory, 2018
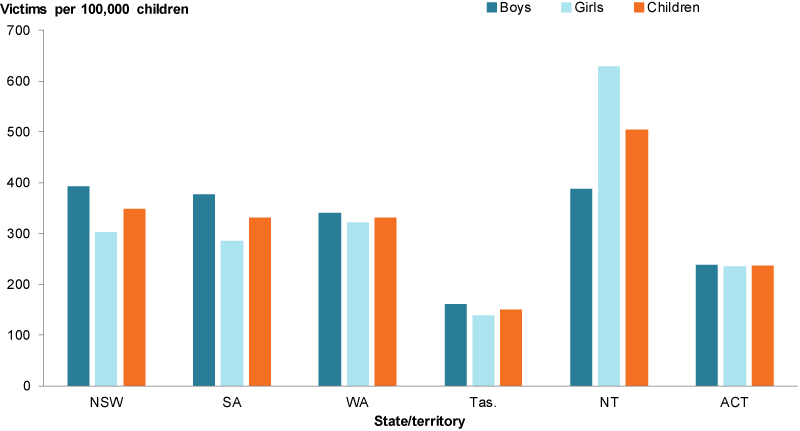
Chart: AIHW. Source: ABS 2019c.
Has the rate of assault changed over time?
Sexual assault
Rates of sexual assault have remained relatively stable in the 5 years leading up to 2018 for both boys and girls, with sexual assault consistently being perpetrated against girls at a far higher rate than boys (Figure 4).
Figure 4: Victims of sexual assault and sex, 2013–2018
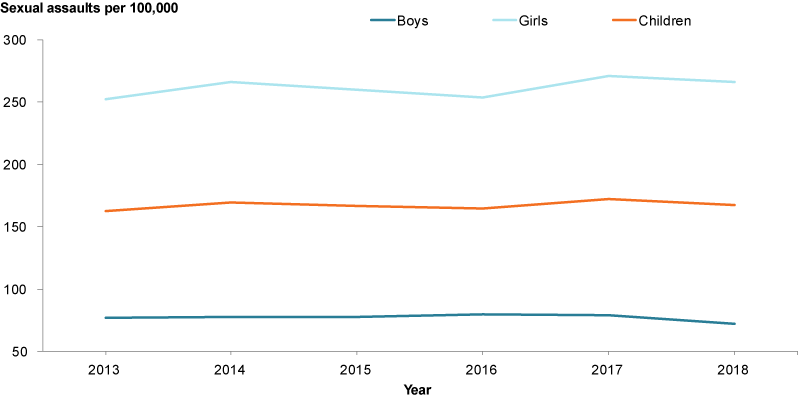
Chart: AIHW. Sources: ABS 2019c.
Other assault
The rate of other assault being perpetrated against children in the Northern Territory fluctuated overtime, but remained consistently higher than all other states and territories (Figure 5). The Northern Territory’s rate decreased by 13%—the largest decease—from 565 per 100,000 children in 2013 to 493 per 100,000 children in 2018. The Australian Capital Territory experienced the largest increase, almost doubling from 133 assaults per 100,000 children in 2013 to 244 assaults per 100,000 children in 2018 (ABS 2019c).
Figure 5: Victims of other assault by jurisdiction, 2013–2018
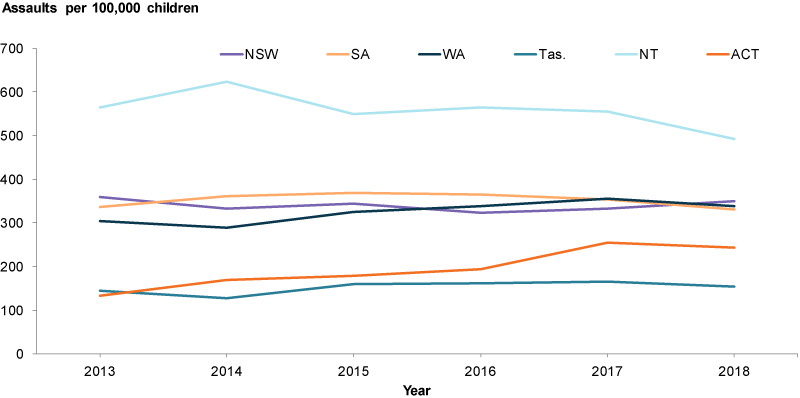
Chart: AIHW. Source: ABS 2019c.
How many children were hospitalised due to assault?
In 2016–17, there were 612 hospitalised assault cases —a rate of 13.3 cases per 100,000 children aged 0–14. Rates of hospitalised assault cases varied for different groups (figures 6, 7 and 8).
The rate of hospitalised assault cases increased with remoteness. Rates for children living in Very remote areas were 8.5 times as high as rates for children living in Major Cities (87 per 100,000 compared with 10 per 100,000).
Children in the lowest socioeconomic areas were also more likely to be hospitalised due to assault than those living in the highest socioeconomic areas (23 and 5 hospitalised cases per 100,000 children, respectively).
Differences were also evident between Indigenous and non-Indigenous children (62 and 10 per 100,000 children, respectively).
Figure 6: Hospitalised assault cases for children aged 0–14, by sex and age, 2016–17
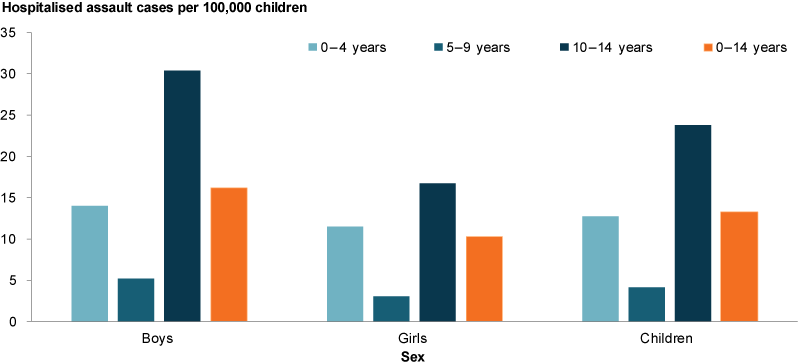
Chart: AIHW. Source: AIHW National Hospital Morbidity Database.
Figure 7: Hospitalised assault cases for children aged 0–14, by age and Indigenous status, 2016–17
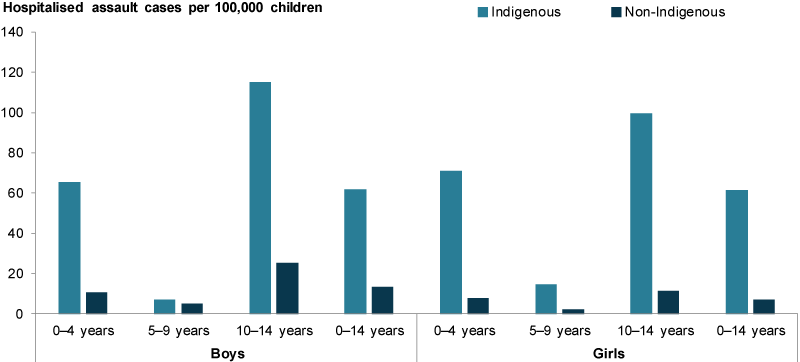
Chart: AIHW. Source: AIHW National Hospital Morbidity Database.
Figure 8: Hospitalised assault cases for children aged 0–14, by selected population characteristics, 2016–17
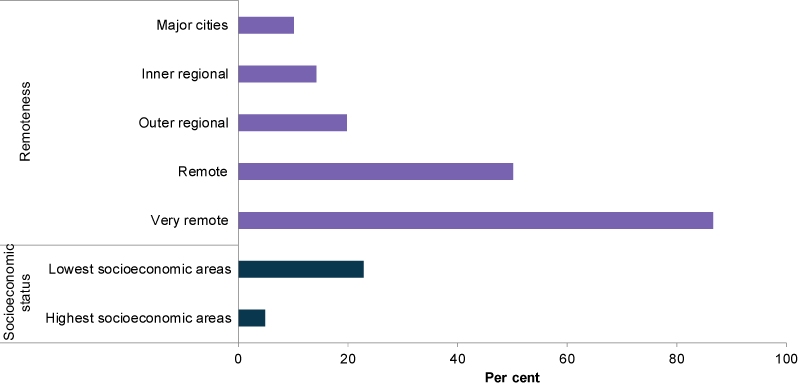
Chart: AIHW. Source: AIHW National Hospital Morbidity Database.
In just under half of all hospitalised assault cases (48%) the perpetrator was a parent, carer or other family member (Figure 9). The perpetrator was unspecified or other in 30% of cases, and identified as an acquaintance or friend in 14% of cases.
Assault by bodily force (48%) was the most common type of assault resulting in a hospitalised assault cases. Other maltreatment syndromes were the second most common, representing 25% of all hospitalised cases.
More information on hospitalised assault cases perpetrated by a parent or other family member (family violence) is available in Children exposed to family violence.
Figure 9: Hospitalised assault cases for children aged 0–14, by perpetrator, 2016–17
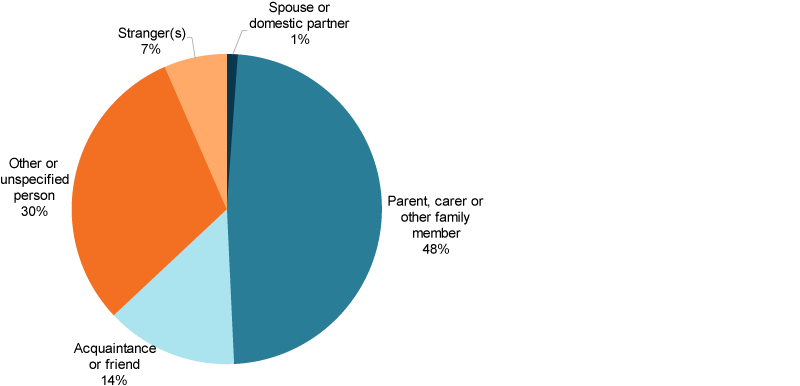
Chart: AIHW. Source: AIHW National Hospital Morbidity Database.
Has the rate of child hospitalised assault cases changed over time?
Between 2007–08 and 2012–13, the rate of hospitalised assault cases for all children aged 0–14 decreased by around 25%, from 17.9 per 100,000 children to 13 per 100,000 (Figure 10). The rate was consistently higher for boys than girls, with the rate for boys showing greater fluctuation while the rate for girls remained more stable.
Figure 10: Hospitalised assault cases for children aged 0–14, by gender, 2016–17
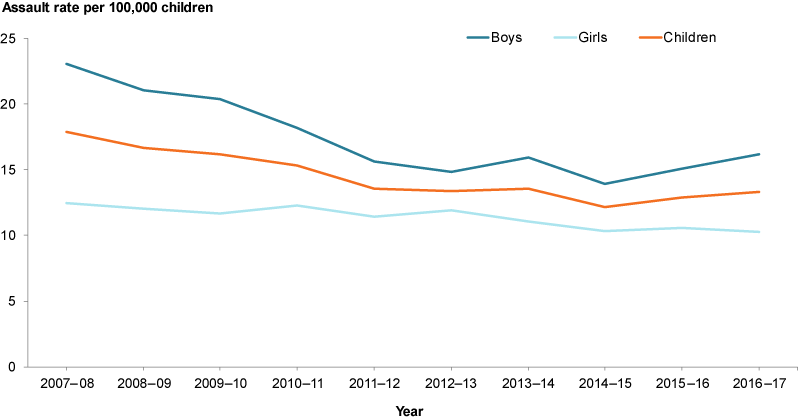
Chart: AIHW. Source: AIHW National Hospital Morbidity Database.
How many children die as a result of homicide?
In 2012–14 there were 35 deaths due to homicide among children aged 0–14, a rate of 0.4 per 100,000 children (Figure 11). There was no difference in the rates of homicide among boys and girls.
The rate for infants under the age of 1 were at least 8 times as high as those for the other 2 age groups (2.3 per 100,000 compared with 0.3 and 0.2 per 100,000 for children aged 1–9 and 10–14, respectively). Homicides were 1.7 times as likely to happen to infant boys as infant girls (2.9 and 1.7 per 100,000, respectively).
Figure 11: Assault deaths (homicides) among children aged 0–14, 2012–14
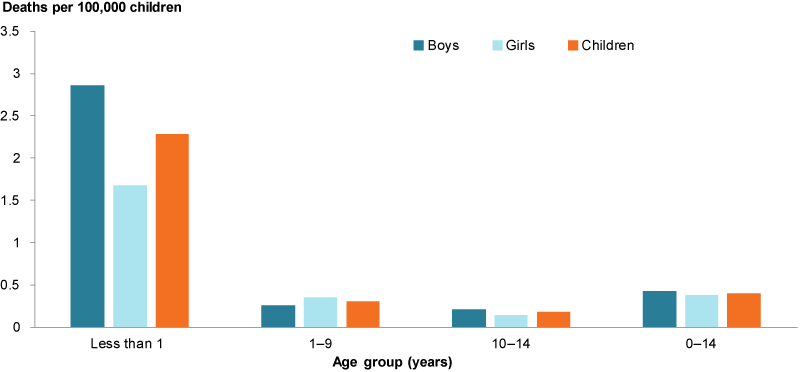
Chart: AIHW. Source: AIHW analysis of Bryant & Bricknell 2017.
How many crimes are perpetrated by children?
Children younger than 10 cannot be charged with a criminal offence in Australia (Box 3). In 2017–18, around 13,800 criminal offences were committed by an unknown number of children aged 10–14. More than two-thirds of these (around 68% or 9,400) were committed by boys and more than two-fifths (around 44% or 6,100) by children aged 14.
Box 3: Age of criminal responsibility
Age of criminal responsibility refers to the age at which a child can be charged with committing a criminal offence. In Australia, this is 10 for all states and territories. However, as children aged 10–14 are not considered to be as capable of understanding the difference between right and wrong as older children, adolescents and adults, prosecutors must demonstrate that a child knew their actions were wrong at the time of the offence for the child to be found guilty and convicted.
The age of criminal responsibility in Australia is 10—one of the lowest ages of criminal responsibility in the world. The United Nations (UN) Human Rights Commission Convention on the Rights of the Child recommends that age of criminal responsibility be no lower than age 12 (UN 2007).
Both the Royal Commission into the Protection and Detention of Children in the Northern Territory and the Royal Australasian College of Physicians (RACP) have recommended that Australia increase the age of criminal responsibility. The RACP suggests that raising the age to 14 allows time for additional brain development especially in terms of decision making, organisation, impulse control and planning a future (RACP 2017, 2011).
The most common principal offences committed by children aged 10–14 varied and included violent and non-violent crimes such as sexual assault and related offences, fraud/deception and illicit drug offences (Figure 12).
The most common principal offence committed by children aged 10–14 was acts intended to cause injury, which includes assault, at a rate of 248 offences per 100,000 children aged 10–14. Homicide and related offences were uncommon among this age group with only 0.2 offences being committed per 100,000 children aged 10–14.
The prevalence rate for all types of offences increased with age with more offences perpetrated per 100,000 14 years old than per 100,000 10 years old. This was especially true for sexual assault and related offences, robbery/extortion, and illicit drug offences.
Figure 12: Ten most common offences among children aged 0–14, 2017–18
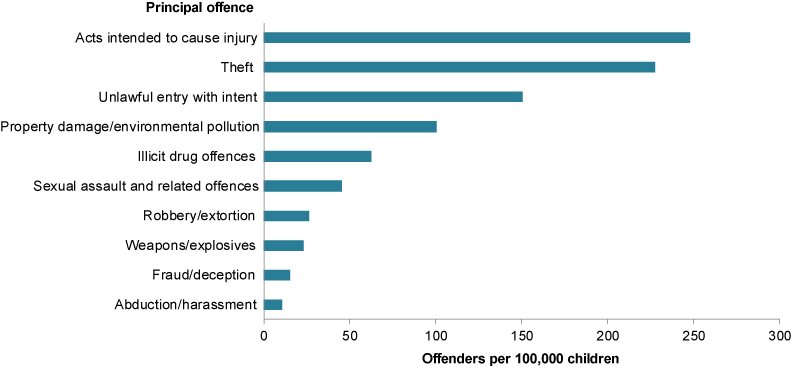
Chart: AIHW. Sources: ABS 2019b.
Some children who committed criminal offences will go on to have contact with Youth justice (see Children under youth justice supervision).
Data limitations and development opportunities
There is currently no comprehensive national data source about children involved in crime—as victims or offenders—beyond selected administrative data sources, such as those data presented here.
While administrative data collections, including police, hospital, and child protection data, can provide some insights, these data sources do not capture all crime and are likely to underestimate the true extent of violence against children (Stoltenborgh et al. 2011, 2013).
There are many reasons why a crime may go unrecorded, but of special relevance to children is that the perpetrator may be known to them or is in a position of power (for example, older or an authority figure) (ABS 2011a). The scope of population surveys which allow individuals to disclose their experience with crime privately, such as the ABS Personal Safety Survey, is older people aged at least over 15 years, and respondents are asked to recall childhood crime experience retrospectively.
Where do I find more information?
For more information on:
- specific types of violence experienced by children, see: Child homicide, Domestic Violence and Child sexual assault in the National Framework for Protecting Australia’s Children
- family, domestic and sexual violence, see: Family, domestic and sexual violence in Australia: continuing the national story.