Satisfaction with health services
Amount of information received
Prison dischargees were asked questions about their experiences with prison health services during their time in prison. They were asked to rate their level of satisfaction with the amount of information about their condition they received during their clinic visits.
More than 4 in 5 (81%) prison dischargees reported they were satisfied with the amount of information on their condition they received at the clinic (Indicator 3.2.1).
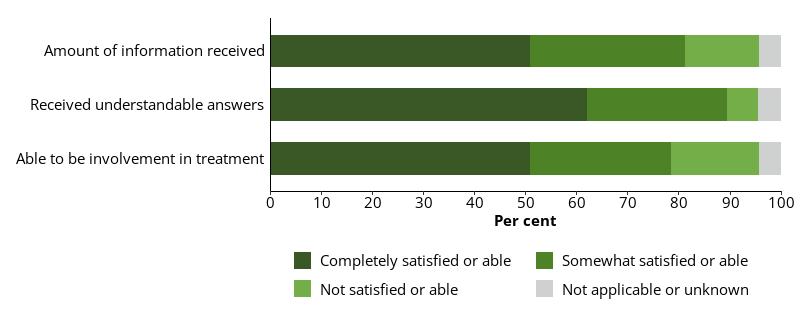
More than a half (51%) of dischargees reported they were completely satisfied with the amount of information they received at the prison clinic, and more than one-quarter (30%) reported they were somewhat satisfied (Figure 11.1).
Figure 11.1: Prison dischargees, self-reported level of satisfaction with aspects of prison clinic visits, 2022
Notes
- Proportions are representative of this data collection only, and not the entire prison population.
- Excludes Victoria, which did not provide data for this item.
Source: Dischargees form, 2022 NPHDC.
Answers could be understood
Prison dischargees were asked how satisfied they were that the answers they received at their clinic visits were easy to understand.
Most (90%) prison dischargees reported they received answers they could understand at the clinic (Indicator 3.2.2).
Nearly two-thirds (62%) of dischargees reported they were completely satisfied that they could understand the answers given to them at the prison clinic, and over one-quarter (27%) reported they were somewhat satisfied (Figure 11.1).
Females (64%) were slightly more likely than males (62%) to report that they were completely satisfied with the answers they received.
Involvement in treatment decisions
Prison dischargees were asked how involved they were able to be in their treatment decisions at the prison clinic.
Nearly 4 in 5 (79%) prison dischargees reported they were able to be involved in their treatment decisions at the clinic (Indicator 3.2.3).
Just over a half (51%) of dischargees reported they were able to be completely involved in their treatment decisions at the prison clinic, and more than one-quarter (28%) said they were able to be somewhat involved (Figure 11.1).
Non-Indigenous dischargees (21%) were more likely than First Nations dischargees (13%) to report they were unable to be involved in their treatment decisions.
Time spent at clinic visits
Prison dischargees were asked to rate whether they had enough time with clinicians during their clinic visits.
Nearly three-quarters (71%) of prison dischargees reported they always or mostly had enough time during their clinic visits (Indicator 3.2.4).
Nearly a half (48%) of dischargees reported they always had sufficient time during their clinic visits, and nearly one-quarter (23%) reported they mostly had enough time. Almost 1 in 7 (15%) reported they rarely or never had enough time during clinic visits.
Patient rating of health care received at prison clinic
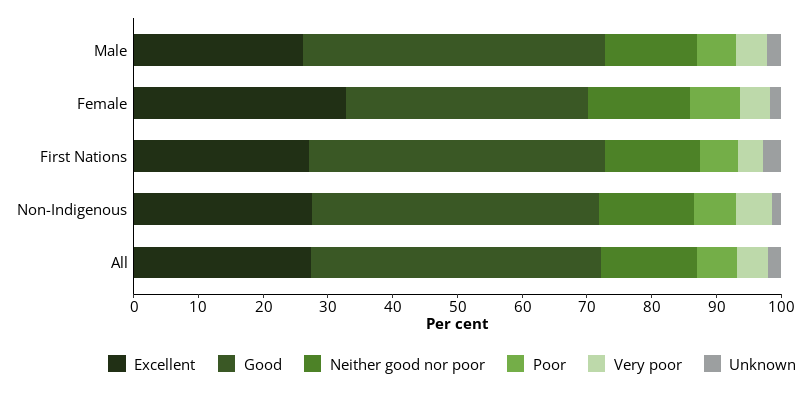
Nearly three-quarters (72%) of prison dischargees rated the health care they received in the prison clinic as good or excellent (Indicator 3.2.5).
Male dischargees (73%) were slightly more likely than female dischargees (70%) to give a positive rating of their health care in prison (Figure 11.2).Prison dischargees were asked to rate the level of health care they received at the prison clinic.
First Nations dischargees (73%) were similarly as likely as non-Indigenous dischargees (72%) to rate their health care as good or excellent and slightly less likely than non‑Indigenous dischargees (10%) to rate their health care as poor or very poor (12%) (Figure 11.2).
Figure 11.2: Prison dischargees, rating of the quality of health care received at the prison clinic, by sex and Indigenous identity, 2022
Notes
- Proportions are representative of this data collection only, and not the entire prison population.
- Excludes Victoria, which did not provide data for this item.
Source: Dischargees form, 2022 NPHDC.
Nutritional value of food in prison
Prison dischargees were asked to rate the nutritional value of their diet in prison.
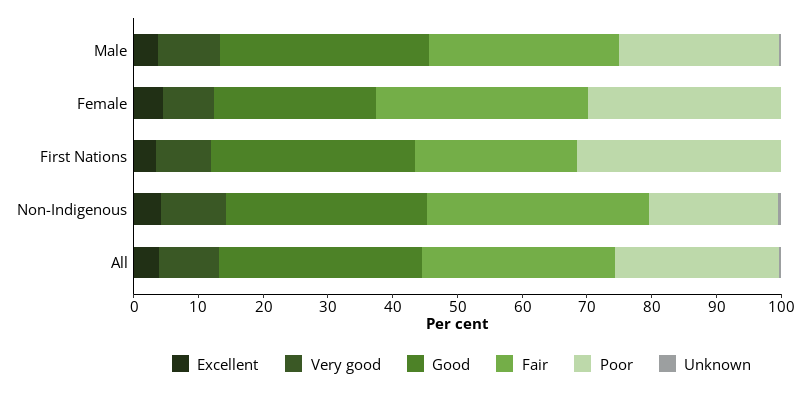
Nearly a half (45%) of prison dischargees rated their diet in prison as excellent, very good or good (Indicator 3.2.6).
Male dischargees were more likely (46%) to rate their diet as good, very good or excellent than female dischargees (38%). Female dischargees were more likely (63%) to rate their diet as fair or poor than male dischargees (54%) (Figure 11.3).
Nearly a half of First Nations dischargees (44%) rated their diet as good, very good or excellent, while 32% rated their diet as poor. Nearly a half (46%) of non-Indigenous dischargees rated their diet as good or better, while 20% rated their diet as poor (Figure 11.3).
Figure 11.3: Prison dischargees, self-reported nutritional value rating of prison diet, by sex and Indigenous identity, 2022
Notes
- Proportions are representative of this data collection only, and not the entire prison population.
- Excludes Victoria, which did not provide data for this item.
Source: Dischargees form, 2022 NPHDC.