Employment
Employment is a social determinant of health, and unemployment is linked with a number of poor psychosocial outcomes, including mental health issues, alcohol and other drug use disorders, and crime (Fergusson et al. 2013; Winter et al. 2019).
People in contact with the criminal justice system already face difficulties in gaining employment, with lower educational attainment, lower socioeconomic status, higher levels of alcohol and other drug use disorders and higher levels of mental health conditions compared with the general community (Sullivan et al. 2019).
A history of detention adds another barrier to employment, particularly for those who have been in prison for longer than 6 months (Ramakers et al. 2014; Winter et al. 2019).
Employment before prison
Prison entrants were asked to describe their employment status in the 30 days before entering prison.
Less than a half (46%) of prison entrants reported they were unemployed during the 30 days before prison (Indicator 2.1.6).
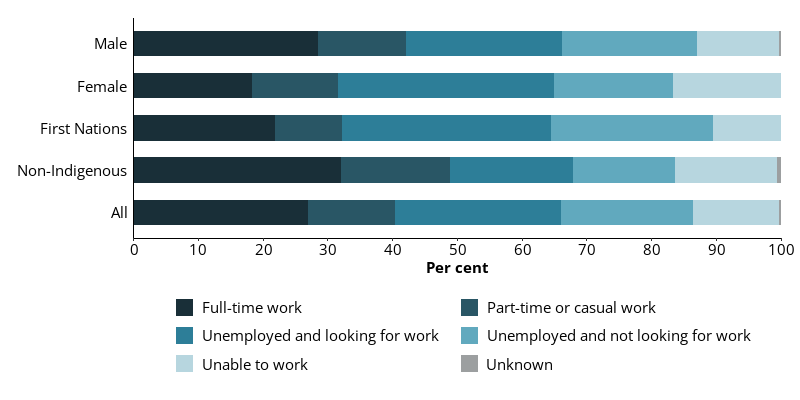
Two in 5 (40%) prison entrants were employed in the 30 days before prison. About 1 in 8 (13%) entrants reported being unable to work due to disability, age, or health conditions (Figure 8.4). Of the 171 entrants who were unemployed, 56% were looking for work while 44% were not looking for work.
One in 3 First Nations entrants (32%) reported they were employed during the 30 days before entering prison, while over a half (57%) reported being unemployed. About 1 in 2 (49%) non-Indigenous entrants reported that they were employed during the 30 days before entering prison, while about 1 in 3 (35%) reported being unemployed (Figure 8.4).
Two in 5 (40%) prison entrants were working, either full time (27%) or part time (13%) before being imprisoned. More males (42%) reported being employed than females (32%), while females (33%) were more likely than males (24%) to report they were unemployed and looking for work (Figure 8.4).
Figure 8.4: Prison entrants, employment status in 30 days before entering prison, by sex and Indigenous identity, 2022
Notes
- Proportions are representative of this data collection, and not the entire prison population.
- Excludes Victoria, which did not provide data for this item.
Source: Entrants form, 2022 NPHDC.
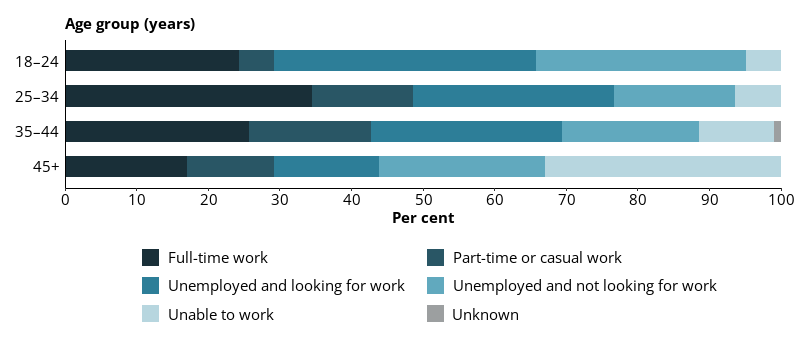
Ability to work varied by age. One in 3 (33%) prison entrants aged 45 and over reported being unable to work, compared with 4.9% of those aged 18–24 (Figure 8.5).
Young prison entrants aged 18–24 were the group most likely to report being unemployed and looking for work (37%), compared with prison entrants aged 45 and over (15%) (Figure 8.5).
Figure 8.5: Prison entrants, employment status in the 30 days before entering prison, by age, 2022
Notes
- Proportions are representative of this data collection, and not the entire prison population.
- Excludes Victoria, which did not provide data for this item.
Source: Entrants form, 2022 NPHDC.
Employment in prison
Employment while in prison is an indicator of government objectives to provide programs and services that address the causes of offending and the limited vocational skills and the poor employment history of some people in prison (which is a key contributor to decreasing recidivism).
Data on prisoner employment came from the Productivity Commission Report on Government Services 2023 (Productivity Commission 2023). Prisoner employment is defined as the number of prisoners employed as a percentage of those eligible to work. Prisoners who are eligible to work exclude those who:
- are unable to work for reasons of ill health or their relatively short periods of imprisonment
- are in full-time education or other full-time programs
- have a protection status that precludes their access to employment
- are fine defaulters in custody for a few days only
- are hospital patients or unable to work due to old age
- are in centres where the jurisdiction’s policy is not to provide work, or where work is unavailable
- are remandees who choose not to work.
Due to factors such as local economic conditions – which affect the capacity to attract commercially viable prison industries, causing employment rates to fluctuate – these results should be interpreted with caution.
Almost 4 in 5 (80%) people eligible to work in prison were employed in prison in 2021–22 (Indicator 2.1.7).
Between 2021–22, 80% of prisoners eligible to work were employed while in prison:
- 51% worked in service industries
- 29% worked in commercial industries
- 0.4% working in work release programs.
Prisoner employment was lower for First Nations people eligible to work (71%) than for non‑Indigenous people eligible to work (84%).
Employment status on release from prison
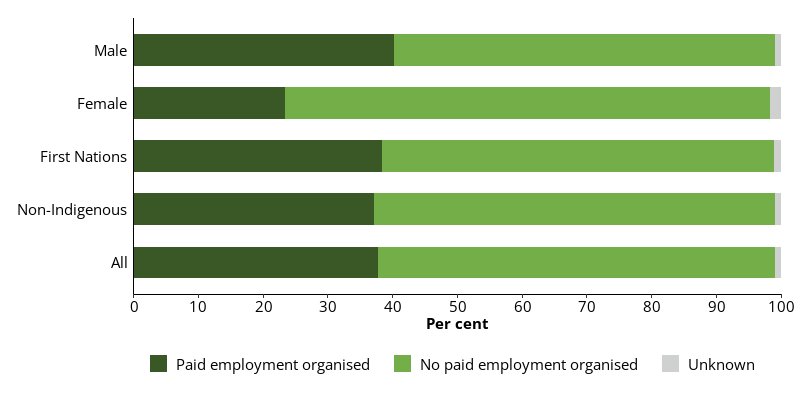
Almost 2 in 5 (38%) prison dischargees had paid employment organised to start within 2 weeks of release from prison (Indicator 2.1.8).
Of 431 prison dischargees, 19% said they had full-time employment organised within 2 weeks of release, 8.8% said they had part-time employment and 10% said they had casual/contract employment. About 3 in 5 (61%) prison dischargees said they did not have paid employment organised (Figure 8.6).
Male dischargees (40%) were more likely than female dischargees (24%) to have organised paid employment upon release (Figure 8.6).
Figure 8.6: Prison dischargees, employment status within 2 weeks of release, by sex and Indigenous identity, 2022
Notes
- Proportions are representative of this data collection, and not the entire prison population.
- Excludes Victoria, which did not provide data for this item.
Source: Dischargees form, 2022 NPHDC.
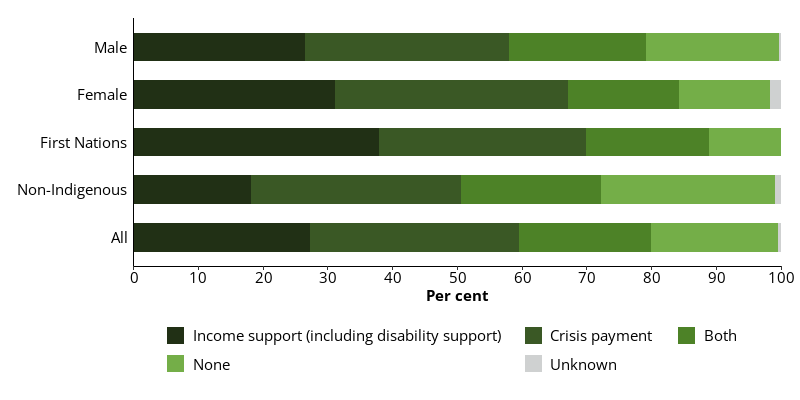
Almost 4 in 5 (80%) prison dischargees expected to receive a government payment through Centrelink on release (Indicator 2.1.9).
About one-quarter (27%) of prison dischargees expected to receive income support, including disability support; 32% expected to receive a crisis payment; and 20% expected to receive both payments (Figure 8.7).
Figure 8.7: Prison dischargees expecting to receive some form of financial assistance from Centrelink, by payment type, 2022
Notes
- Proportions are representative of this data collection, and not the entire prison population.
- Excludes Victoria, which did not provide data for this item.
Source: Dischargees form, 2022 NPHDC.