Health professionals consulted
Health professionals consulted in the community
Almost 3 in 4 (71%) prison entrants reported they had seen a health professional in the community in the previous 12 months (Indicator 3.1.4).
Females (88%) were more likely than males (67%) to report consulting a health professional in the community in the previous 12 months.Health professionals consulted in the community
Almost 2 in 3 (63%) First Nations prison entrants reported that they consulted a health professional in the community in the previous 12 months, while 1 in 3 (37%) did not.
About 3 in 4 (78%) non-Indigenous prison entrants reported consulting a health professional in the community in the previous 12 months.
The likelihood of prison entrants reporting that they had seen a health professional in the community in the previous 12 months increased with age. Prison entrants aged 18–24 (49%) were the least likely to report seeing a health professional in the community, and those aged 45 and over (83%) were the most likely.
Health professionals seen in prison
Over 2 in 3 (70%) prison entrants who had been in prison in the previous 12 months reported seeing a health professional in prison during that time (Indicator 3.1.5).
Of 371 prison entrants, 41% reported they had been in prison in the previous 12 months. Of these entrants, females (70%) and males (70%) were equally as likely to report consulting a health professional while in prison.
First Nations prison entrants (75%) were more likely to report consulting a health professional in prison than non-Indigenous prison entrants (65%).
Type of health professional seen
Of 371 prison entrants, 60% reported seeing a doctor or general practitioner (GP) in the community in the previous 12 months, and 32% reported seeing a nurse (Figure 10.2).
More than a half (53%) of First Nations prison entrants reported seeing a doctor or GP in the community in the previous 12 months, 32% reported seeing a nurse and 20% reported seeing an alcohol or drug worker.
About 2 in 3 (67%) non-Indigenous prison entrants reported seeing a doctor or GP in the community in the previous 12 months, 33% reported seeing a nurse and 22% reported seeing an alcohol or drug worker.
Of 153 prison entrants who had been in prison in the previous 12 months, 46% reported seeing a doctor or GP, while 65% reported seeing a nurse in prison (Figure 10.2).
Figure 10.2: Prison entrants, self-reported consultation with a health professional in the community or in prison in the previous 12 months, by type of health professional, 2022
Notes
- Proportions are representative of this data collection only, and not the entire population.
- Proportions of prison entrants who saw a health professional in prison in the past 12 months are proportions of prison entrants who reported being in prison in the past 12 months and not all prison entrants in this data collection.
- Excludes Victoria, which did not provide data for this item.
Source: Entrants form, 2022 NPHDC.
Comparisons with the general community
In 2021–22, most people aged 15 and over (84%) in Australia reported seeing a GP in the preceding 12 months, and nearly a half (49%) said they had seen a dentist (ABS 2022).
These proportions were higher than the 60% of prison entrants who reported seeing a GP in the community, and the 15% who said they saw a dentist in the past 12 months; however, the prison population is younger than the general Australian population, and health care needs tend to increase with age.
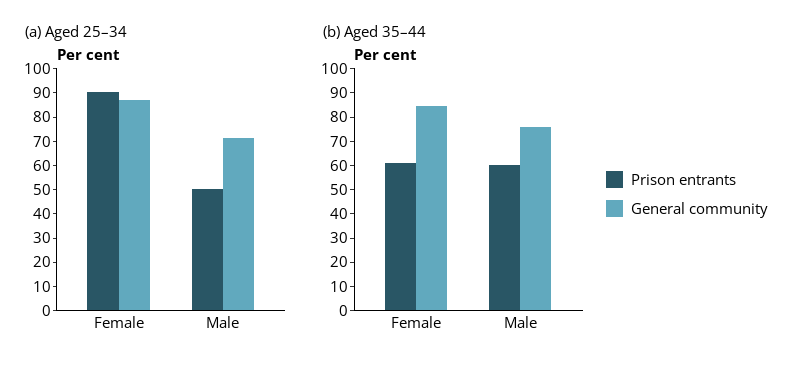
Nine in 10 (90%) female prison entrants aged 25–34 reported seeing a GP in the previous 12 months as did almost 9 in 10 (87%) females of the same age in the community. Among female prison entrants aged 35–44, 61% reported seeing a GP in the previous 12 months compared with 84% of females of the same age in the community.
A half (50%) of male prison entrants aged 25–34 reported consulting a GP in the previous 12 months as did almost 3 in 4 (71%) males of the same age in the community. Among male prison entrants aged 35–44, 60% reported seeing a GP in the previous 12 months compared with 76% of males of the same age in the general community (Figure 10.3).
Figure 10.3: Prison entrants (2022) and the general community (2021–22), self-reported consultation with a GP in the community in the previous 12 months, by age and sex
Notes
- Proportions of prison entrants are representative of this data collection only, and not the entire prison population.
- Excludes Victoria, which did not provide data for this item.
Sources: ABS 2022; Entrants form, 2022 NPHDC.