Self-assessed physical health
Prison entrants and prison dischargees were asked to rate their current physical health; as well, prison dischargees were asked how their physical health had changed during their time in prison.
Self-assessed physical health of prison entrants
More than 3 in 4 (77%) prison entrants rated their physical health as good, very good or excellent (Indicator 1.1.1).
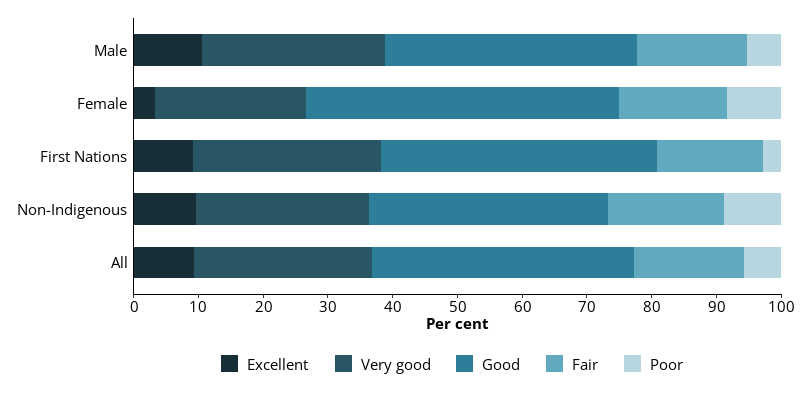
Almost one-quarter (23%) of prison entrants rated their physical health as fair or poor (Figure 2.1). Female entrants (25%) were similar to male entrants (22%) in rating their physical health as fair or poor.
First Nations entrants (38%) were similarly as likely as non-Indigenous entrants (36%) to rate their health as very good or excellent.
Figure 2.1: Prison entrants, self-assessed physical health status, by sex and Indigenous identity, 2022
Notes
- Proportions are representative of this data collection only, and not the entire prison population.
- Excludes Victoria, which did not provide data for this item.
Source: Entrants form, 2022 NPHDC.
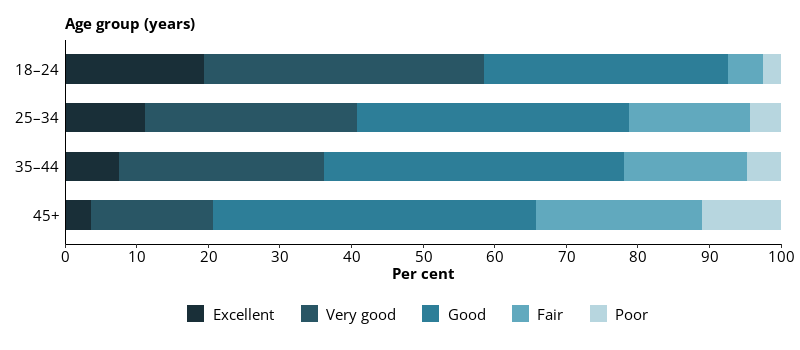
Self-assessed physical health rates differed by age (Figure 2.2). More than 1 in 3 (34%) prison entrants aged 45 and over rated their physical health as fair or poor compared with about 1 in 5 (19%) entrants aged under 45.
Figure 2.2: Prison entrants, self-assessed physical health status, by age, 2022
Notes
- Proportions are representative of this data collection only, and not the entire prison population.
- Excludes Victoria, which did not provide data for this item.
Source: Entrants form, 2022 NPHDC.
Self-assessed physical health of prison dischargees
Almost 8 in 10 (79%) prison dischargees rated their physical health as good, very good or excellent (Indicator 1.1.2).
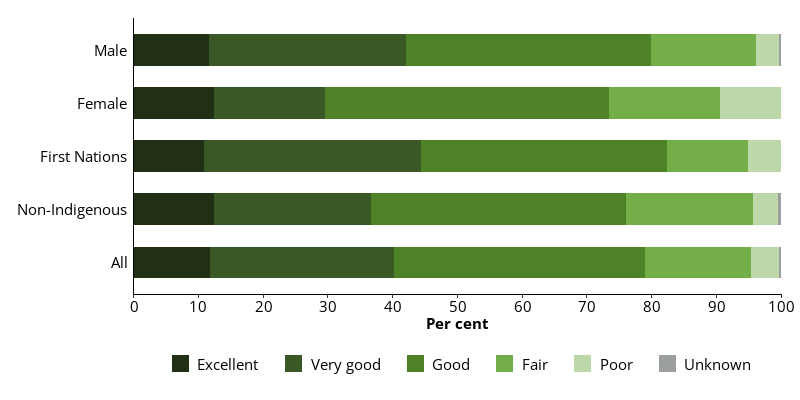
About 1 in 5 (21%) prison dischargees rated their physical health as fair or poor. Female dischargees (27%) were more likely than male dischargees (20%) to rate their physical health as fair or poor (Figure 2.3).
First Nations dischargees were more likely to rate their physical health as very good or excellent (45%) than non-Indigenous dischargees (37%) (Figure 2.3).
Figure 2.3: Prison dischargees, self-assessed physical health status, by sex and Indigenous identity, 2022
Notes
- Proportions are representative of this data collection only, and not the entire prison population.
- Excludes Victoria, which did not provide data for this item.
Source: Dischargees form, 2022 NPHDC.
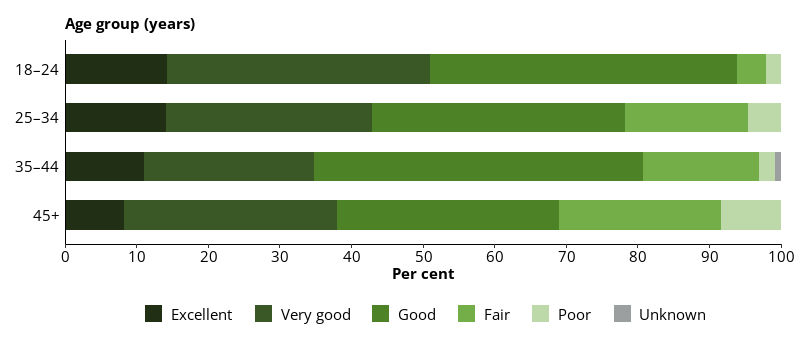
Self-assessed physical health ratings also differed by age. Of prison dischargees aged 45 and over, 31% rated their physical health as fair or poor compared with 6.1% of those aged 18–24.
In every age group, except those aged 25–34 and 45 and over, prison dischargees were more likely than prison entrants to rate their health as good, very good or excellent (figures 2.2 and 2.4).
Figure 2.4: Prison dischargees, self-assessed physical health status, by age, 2022
Notes
- Proportions are representative of this data collection only, and not the entire prison population.
- Excludes Victoria, which did not provide data for this item.
Source: Dischargees form, 2022 NPHDC.
As well as rating their current physical health, prison dischargees were asked if it had changed since entering prison. Almost 4 in 5 (80%) reported that their physical health had improved or stayed the same while in prison.
One in 5 (20%) prison dischargees reported that their physical health had worsened during incarceration (Figure 2.5).
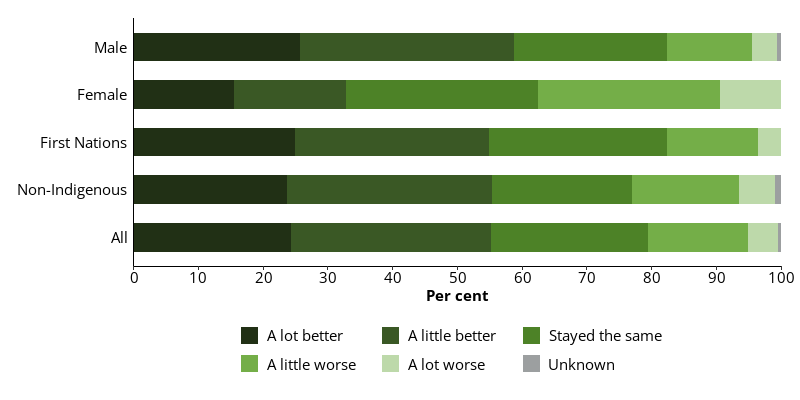
Females (33%) were less likely than males (59%) to report improved physical health and were more likely than males to report that it had worsened during their time in prison – 38% of female prison dischargees and 17% of male prison dischargees said it had worsened.
Just over a half (55%) of First Nations and non-Indigenous dischargees reported that their physical health had improved. First Nations dischargees (18%) were fairly similarly as likely to report that it had worsened during incarceration as non-Indigenous dischargees (22%).
Figure 2.5: Prison dischargees, self-assessed change in physical health status in prison, by sex and Indigenous identity, 2022
Notes
- Proportions are representative of this data collection only, and not the entire prison population.
- Excludes Victoria, which did not provide data for this item.
Source: Dischargees form, 2022 NPHDC.
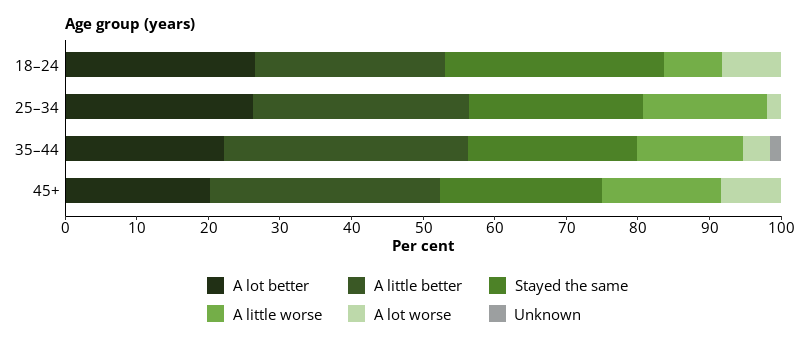
Around one-quarter of prison dischargees aged 18–24 (27%) and 25–34 (26%) reported that their health had improved a lot during incarceration (Figure 2.6). However, the proportions of those reporting that their health worsened during incarceration increased with age, from 16% of those aged 18–24 to 25% of those aged 45 and over.
Figure 2.6: Prison dischargees, self-assessed change in physical health status in prison, by age, 2022
Notes
- Proportions are representative of this data collection only, and not the entire prison population.
- Excludes Victoria, which did not provide data for this item.
Source: Dischargees form, 2022 NPHDC.
Self-assessed physical health comparisons with the general community
The ABS National Health Survey collected self-reported data from the general Australian community in 2020–21 (ABS 2022), including a question to rate their health.
In the NPHDC surveys, participants were asked to rate their physical health so any comparisons must be made with caution. As well, the general Australian community has an older age structure than the prison population, making overall comparisons difficult.
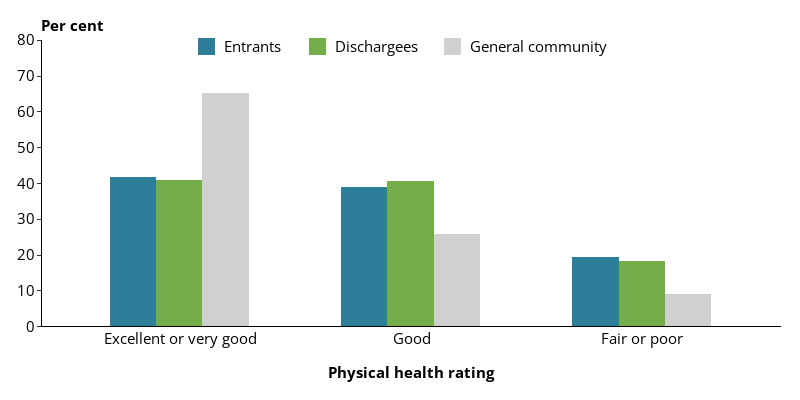
Adults aged 18–44 in the general community (65%) were about 1.5 times more likely than prison entrants (42%) and prison dischargees (41%) of the same age to rate their health as very good or excellent (Figure 2.7). Prison entrants (19%) and prison dischargees (18%) aged 18–44 were about twice as likely to rate their physical health as fair or poor as people of the same age in the general community (9.1%).
Figure 2.7: Prison entrants, prison dischargees and the general community (2020–21) aged 18–44, self-assessed health status, 2022
Notes
- Proportions are representative of this data collection only, and not the entire prison population.
- Excludes Victoria, which did not provide data for this item.
Source: Entrants and dischargees forms, 2022 NPHDC; AIHW calculations of data in ABS 2022, Table 1.3.
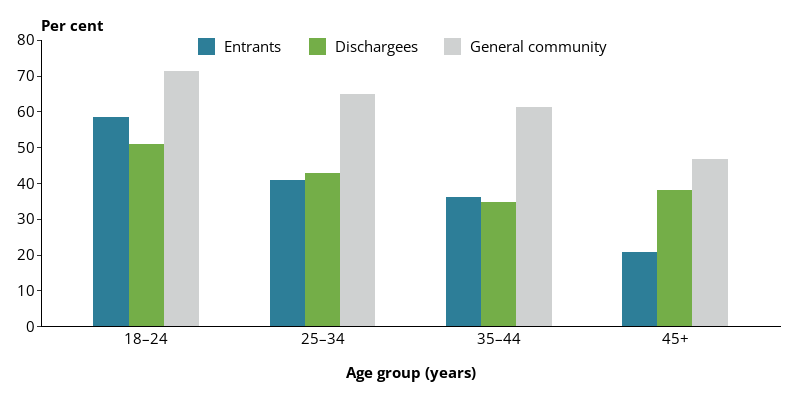
In both the general community and the prison population, the proportion of people who rated their health as very good or excellent declined with age (Figure 2.8). But prison entrants and prison dischargees started to rate their health less positively at younger ages than those in the general community.
This is consistent with literature that shows ‘accelerated ageing’ in prison (Baidawi et al. 2011) as prisoners’ self-reported health was the equivalent of someone in the general population who was up to 40 years older. For example, 36% of prison entrants aged 35–44 rated their health as excellent or very good while 32% of those in the community aged 75 and over rated their health as excellent or very good (ABS 2022). This pattern was particularly noticeable among people entering prison.
Figure 2.8: Prison entrants, prison dischargees and the general community (2020–21), self‑assessed physical health status of very good or excellent, by age, 2022
Notes
- Proportions are representative of this data collection only, and not the entire prison population.
- Excludes Victoria, which did not provide data for this item.
Source: Entrants and dischargees forms, 2022 NPHDC; AIHW calculations of data in ABS 2022, Table 1.3.