Use of prison clinics
People entering prison are routinely given an initial health assessment to provide clinicians with an indication of the health, and health needs, of the individual and whether referral for further assessment or treatment is required.
Use of prison clinics by prison dischargees
Prison dischargees were asked if they had received a health assessment on entry to prison and whether they were referred for further assessment or treatment as a result.
About 9 in 10 (90%) prison dischargees reported they received a health assessment when they entered prison (Indicator 3.1.10).
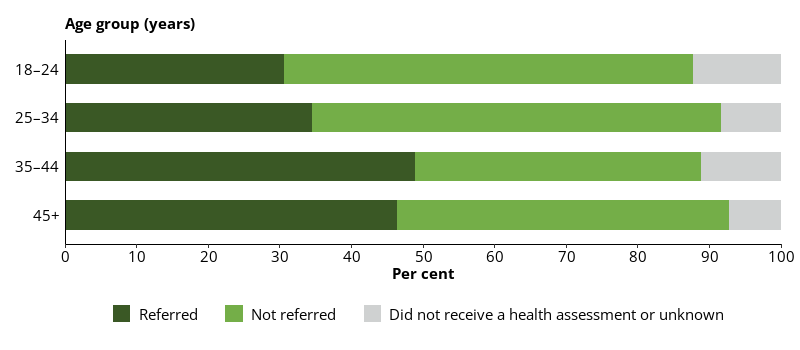
Prison dischargees aged 45 and over were the most likely to report they had received an initial health assessment on prison entry (92%), and those aged 35–44 were the least likely (87%).
Around 2 in 5 (41%) dischargees had been referred for further assessment or treatment following their initial health assessment on entry. Females (53%) were more likely to report receiving a referral than males (39%).
Dischargees aged 35–44 (49%) were the most likely to report receiving a referral on prison entry, followed by those aged 45 and over (46%); dischargees aged 18–24 were the least likely (31%) (Figure 10.4).
Figure 10.4: Prison dischargees, self-reported referral after initial health assessment on prison entry, by age, 2022
Notes
- Proportions are representative of this data collection only, and not the entire prison population.
- Excludes Victoria, which did not provide data for this item.
Source: Dischargees form, 2022 NPHDC.
The health professionals to whom dischargees reported most commonly being referred to after an initial health assessment on entering prison were doctors/GPs (65%), nurses (52%), mental health nurse or team (32%) and alcohol and drug counsellors (25%).
Prison dischargees were asked if they could easily see a doctor/GP and/or nurse when required while they were in prison.
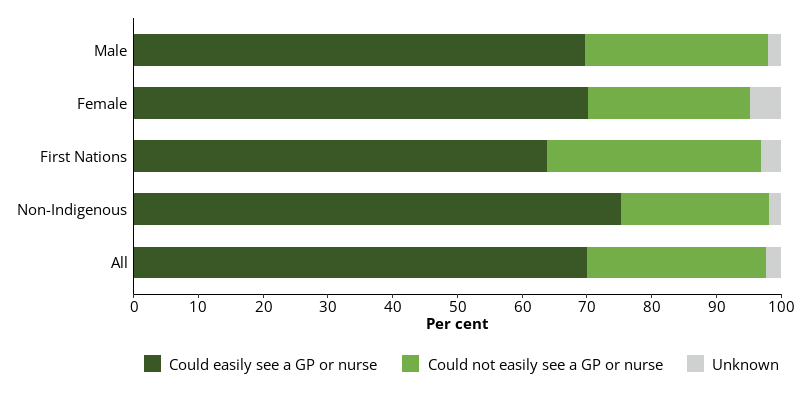
More than two-thirds (70%) of prison dischargees reported they could easily see a medical professional (GP or nurse) while in prison (Indicator 3.1.11).
More than two-thirds (69%) of prison dischargees said they could easily see a nurse in prison, but fewer than a half (46%) said they could easily see a doctor or GP. Prison clinics are usually a nurse-led system of care, so this finding is consistent with this practice.
About two-thirds (64%) of First Nations prison dischargees reported they could easily see a medical professional while in prison, while one-third (33%) reported they could not (Figure 10.5).
Three-quarters (75%) of non-Indigenous prison dischargees reported they could easily see a medical professional while in prison, while almost one-quarter (23%) reported they could not (Figure 10.5).
Figure 10.5: Prison dischargees, self-reported, ease of access to a GP or nurse in prison, by sex and Indigenous identity, 2022
Notes
- Proportions are representative of this data collection only, and not the entire prison population.
- Excludes Victoria, which did not provide data for this item.
Source: Dischargees form, 2022 NPHDC.
Younger prison dischargees found it more difficult to see a doctor/GP or nurse in prison than older prison dischargees. About a half (53%) of prison dischargees aged 18–24 said they could easily see a GP or nurse in prison. Over two-thirds of prison dischargees aged 25–34 (69%) and 35–44 (70%) could easily see a GP or nurse while in prison. Those aged 45 and over (81%) were the group most likely to report they could easily see a GP or nurse.
Prison dischargees were asked whether they had visited the prison clinic during their time in prison.
About 9 in 10 (93%) prison dischargees reported visiting the prison clinic while in prison (Indicator 3.1.12).
All (100%) female prison dischargees and 9 in 10 (92%) male prison dischargees reported visiting the prison clinic while in prison.
Older dischargees were more likely to report visiting the prison clinic than younger dischargees. Over 9 in 10 (96%) prison dischargees aged 45 and over reported visiting the prison clinic, as did 4 in 5 (82%) dischargees aged 18–24.
Of 431 prison dischargees, 6.0% reported they did not visit the prison clinic while in prison. The most common reasons cited by dischargees for not visiting the prison clinic were:
- they felt at the time they didn’t need to or want to (27%)
- other (23%)
- they were refused access to the clinic (15%).
Use of prison clinic by people in custody
Information about how people in prison used the clinic was collected as part of the 2022 NPHDC. Health professionals completed a clinic visit form for every consultation attended by a person in custody who provided consent during the 2-week data collection. The form included demographic information about the patient, the problem managed, and the type of health professional the patient saw.
Not all clinic visits were able to be recorded and the following results are likely an underestimate of the true proportions of people accessing the clinics. Proportions were calculated as a percentage of all people in participating prisons on a snapshot day, 30 June 2022, provided by the ABS.
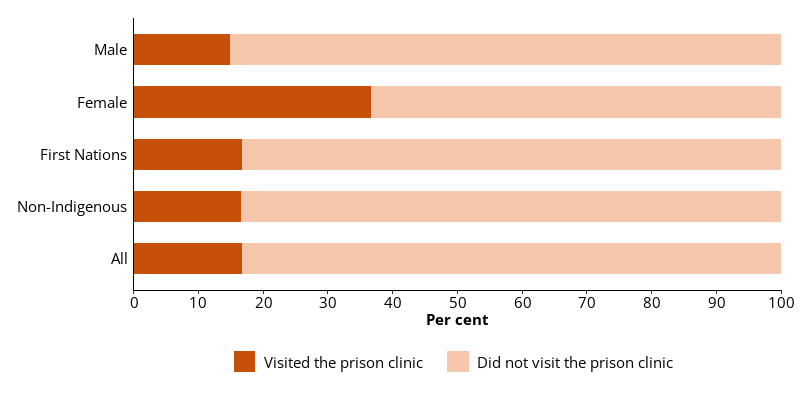
About 1 in 6 (17%) people in custody attended the prison clinic during the 2-week data collection period (Indicator 3.1.13).
Females were more likely (37%) than males (15%) to visit the prison clinics during the 2‑week data collection period (Figure 10.6).
First Nations people in custody (17%) and non-Indigenous Australians in custody (17%) were equally as likely to visit the prison clinics (Figure 10.6).
Figure 10.6: People in custody, visits to the prison clinic in the 2-week data collection period, by sex and Indigenous identity, 2022
Notes
- Proportions are representative of this data collection only, and are likely an underestimate of the true proportions of people who visited the prison clinics in the 2-week data collection period.
- Excludes Victoria, which did not provide data for this item.
Source: Clinic form, 2022 NPHDC.
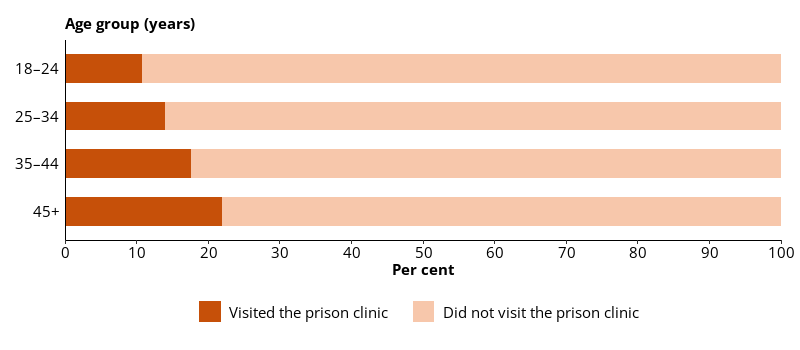
The proportion of people in custody who visited the prison clinic during the 2-week data collection period increased with age (Figure 10.7).
People aged 18–24 (11%) were the least likely group to have visited the prison clinic during the 2-week data collection period, while those aged 45 and over (22%) were the group most likely to have done so (Figure 10.7).
Figure 10.7: People in custody, visits to the prison clinic in the 2-week data collection period, by age, 2022
Notes
- Proportions are representative of this data collection only, and are likely an underestimate of the true proportions of people who visited the prison clinics in the 2-week data collection period.
- Excludes Victoria, which did not provide data for this item.
Source: Clinic form, 2022 NPHDC.
Number of visits per patient
There were 6,651 clinic visits, attended by 4,489 people in custody (or patients) recorded on the clinic visit forms, or 1.5 clinic visits per patient.
Females (1.7 visits per female patient) typically attended more clinic visits during the 2-week data collection period than males (1.4 visits per male patient).
The rate of clinic visits per patient increased with age, with patients aged 18–24 attending an average of 1.3 visits, and those aged 45 and over attending an average of 1.6 visits.
Number of problems managed per patient
During the 2-week data collection period in 2022, 1.5 problems, on average, were managed per visit.
Females (1.6 problems per patient) had slightly more problems managed, on average, than males (1.4 per patient).
The number of problems managed per visit increased with age. Patients aged 18–24 had an average of 1.4 problems managed per patient, and those aged 45 and over had an average of 1.5 problems managed.
Conditions managed at the prison clinic
Health professionals in the prison clinics recorded the problem or condition managed at the clinic visits during the 2-week data collection period. Multiple conditions were recorded per visit, where necessary.
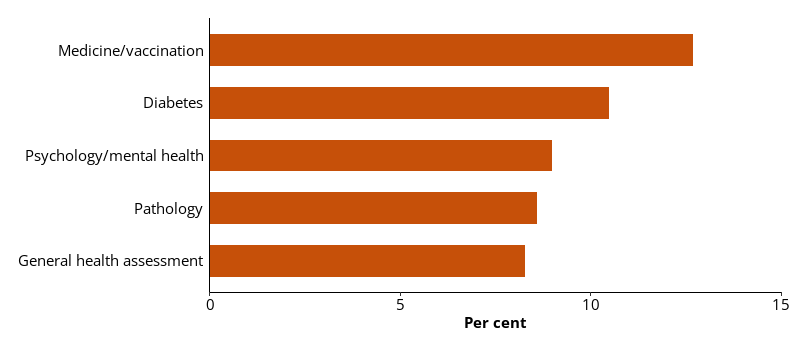
During the data collection period, 9,686 specified conditions were managed during 6,651 clinic visits. Of those specified conditions:
- 13% were related to medication or vaccination
- 11% were diabetes related
- 9.0% were mental health related
- 8.6% were related to pathology
- 8.3% were general health assessments (Figure 10.8).
Figure 10.8: Conditions managed at clinic visits, by type of condition, 2022
Notes
- Proportions are representative of this data collection only, and not the entire prison population.
- Excludes Victoria, which did not provide data for this item.
Source: Clinic form, 2022 NPHDC.
The types of conditions managed, as specified on the clinic visit form, differed according to the sex of the patient.
Males were more than 5 times as likely as females to be managed for a condition related to diabetes, 2 times as likely to be managed for wound care and twice as likely to be managed for cardiovascular disease or a respiratory condition.
Females were 10 times more likely than males to be managed for a condition related to a communicable disease; almost 3 times as likely to be managed for pathology; and equally as likely to be managed for alcohol or drug use, dental conditions, asthma, neurological conditions and malignancies.
The types of conditions managed in the clinic also varied with age. The likelihood of conditions like diabetes, cardiovascular disease, musculoskeletal conditions and arthritis being managed at the clinic increased with age.
Management of conditions like psychological/mental health conditions and musculoskeletal injuries decreased with age.