Activity and weight changes
Physical activity and body weight are 2 major indicators associated with health outcomes (AIHW 2021). The Australian guidelines for weekly physical activity suggest adults aged 18– 64 should engage in either:
- 1.25–2.5 hours of vigorous intensity activity per week
- 2.5–5 hours of moderate intensity activity per week (Department of Health 2021).
Some people are underweight when they enter prison and intend to increase their body weight and/or muscle mass in prison to improve their health. For some people, weight changes occur as a result of regular scheduled meals, which they may not consume in the community. As well, prison can offer people the opportunity to improve their physical fitness if they have access to gym equipment and time to increase their level of physical activity.
Prison dischargees were asked about their level of physical activity during their time in prison. They were also asked whether their weight had changed, and whether they were intentionally trying to gain weight in prison.
Prison dischargees activity and weight changes in custody
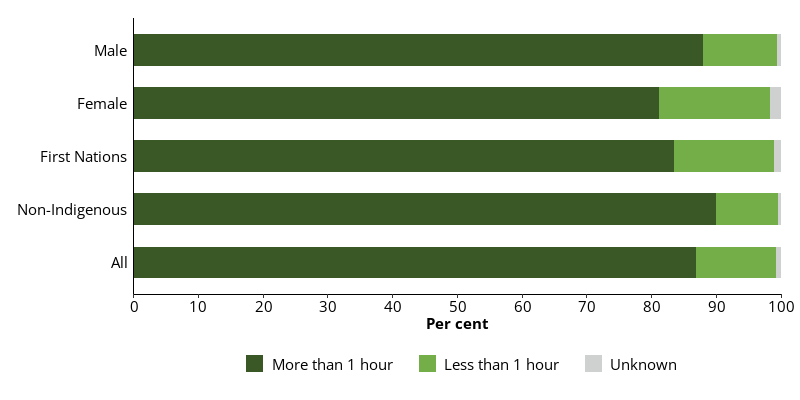
Almost 9 in 10 (87%) prison dischargees reported that they did more than 1 hour of physical activity per week in the previous month (Indicator 1.1.3).
Prison dischargees aged 18–24 and 45 and over (90%) were the most likely to report that they did more than 1 hour of physical activity per week in the previous month, while prison dischargees aged 25–34 (85%) were the least likely to.
Non-Indigenous dischargees (90%) were more likely to report that they did more than 1 hour of physical activity per week in the previous month than First Nations dischargees (84%) (Figure 2.9).
Male dischargees (88%) were more likely than female prison dischargees (81%) to report that they did more than 1 hour of physical activity (Figure 2.9).
Figure 2.9: Prison dischargees, completed more than 1 hour of physical activity per week in the previous month, by sex and Indigenous identity, 2022
Notes
- Proportions are representative of this data collection only, and not the entire prison population.
- Excludes Victoria, which did not provide data for this item.
Source: Dischargees form, 2022 NPHDC.
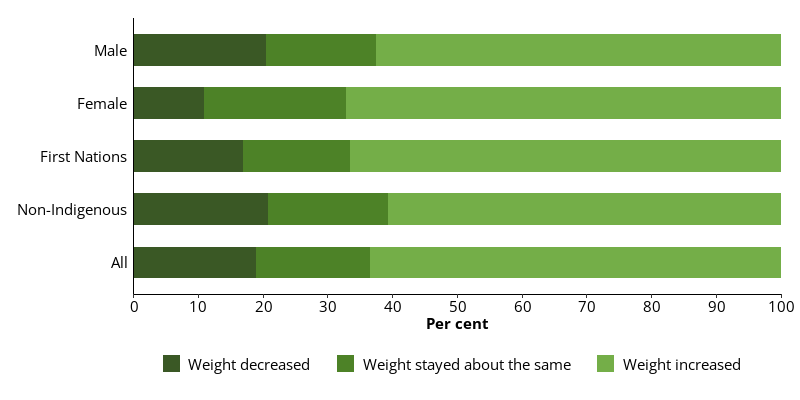
When asked whether their weight had changed during their time in prison, most dischargees reported their weight had increased (63%). About 1 in 5 (19%) dischargees reported that their weight decreased in prison, while nearly 1 in 5 (18%) dischargees reported their weight had stayed the same (Figure 2.10).
Non-Indigenous dischargees (61%) were less likely to report a weight gain during incarceration than First Nations dischargees (67%). Female dischargees (67%) were more likely than male dischargees (63%) to report a weight gain during their time in prison.
Figure 2.10: Prison dischargees, change in weight while in prison, by sex and Indigenous identity, 2022
Notes
- Proportions are representative of this data collection only, and not the entire prison population.
- Excludes Victoria, which did not provide data for this item.
Source: Dischargees form, 2022 NPHDC.
Prison dischargees aged 25–34 (69%) were more likely than dischargees in the other age groups to report a weight gain.
Intention to gain weight
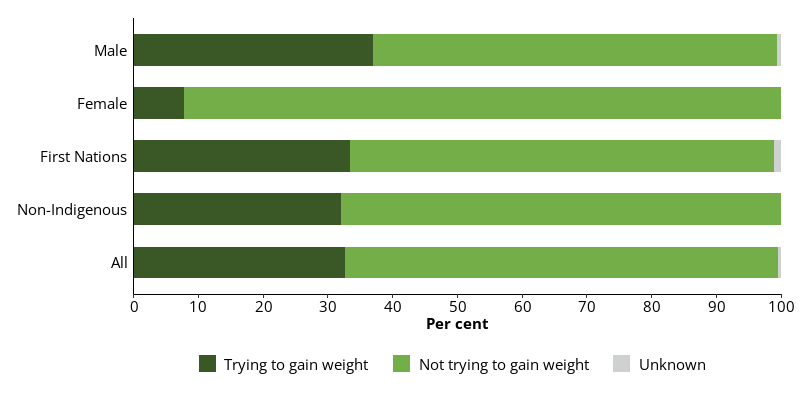
About 1 in 3 (33%) prison dischargees reported they had intended to gain weight while in prison, while more than 2 in 3 (67%) reported they did not. More than 1 in 3 (37%) male dischargees and fewer than 1 in 12 (7.8%) female dischargees reported that they intended to increase their body weight while in prison (Figure 2.11). Female dischargees (92%) overwhelmingly reported they did not try to gain weight in prison compared with more than 3 in 5 (63%) male dischargees.
Figure 2.11: Prison dischargees, intention to gain weight in prison, by sex and Indigenous identity, 2022
Notes
- Proportions are representative of this data collection only, and not the entire prison population.
- Excludes Victoria, which did not provide data for this item.
Source: Dischargees form, 2022 NPHDC.
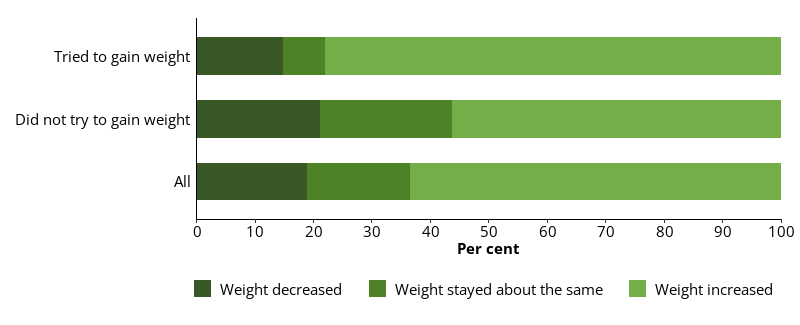
Of the 141 prison dischargees who were trying to gain weight in prison, 78% reported their weight had increased, 7.1% reported their weight had stayed the same and 15% reported their weight had decreased (Figure 2.12). Of the 288 prison dischargees who were not trying to gain weight, 56% reported their weight had increased, 23% reported their weight had stayed the same and 21% reported their weight had decreased while in prison.
Figure 2.12: Prison dischargees, change in weight while in prison, by intention to gain weight, 2022
Notes
- Proportions are representative of this data collection only, and not the entire prison population.
- Excludes Victoria, which did not provide data for this item.
Source: Dischargees form, 2022 NPHDC.