Services received during prison clinic visits
For each clinic visit recorded on the clinic visit form during the 2-week data collection period, clinicians reported the service(s) a patient received.
Of the 6,651 clinic visit forms completed, 10,073 services were provided – an average of 1.5 services per visit. The services administered were:
- treatment (55% of all services)
- assessment only (48%)
- advice and education (38%)
- referrals (9.8%).
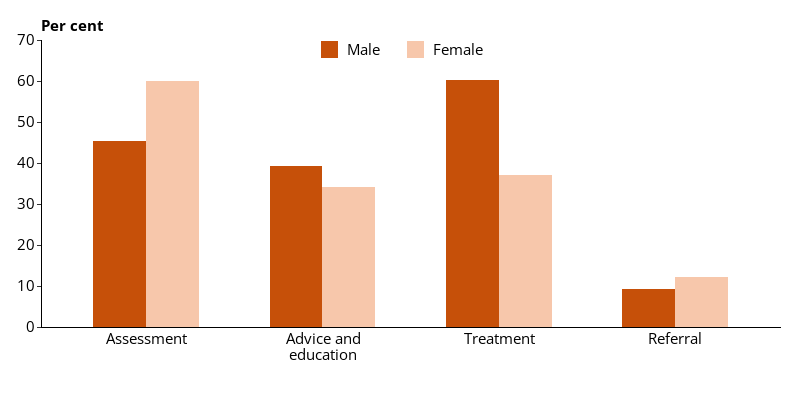
Males (60%) were more likely than females (37%) to receive treatment during a prison clinic visit. But females (60%) were more likely than males (45%) to receive an assessment only (Figure 10.9).
Younger people in prison were more likely than older people in prison to attend for advice or education during a clinic visit:
- 40% of those aged 18–24
- 41% of those aged 25–24
- 38% of those aged 35–44
- 35% of those aged 45 and over.
Older people in prison were more likely than younger people in prison to attend for treatment during a clinic visit:
- 52% of those aged 18–24
- 53% of those aged 25–24
- 57% of those aged 35–44
- 57% of those aged 45 and over.
Figure 10.9: Type of service provided during clinic visit, by sex, 2022
Notes
- Multiple types of services could be provided during a single clinic visit.
- Proportions are representative of services provided at clinic visits in this data collection only, and not the entire prison population.
- Excludes Victoria, which did not provide data for this item.
Source: Clinic form, 2022 NPHDC.